
III. QUALITY TEST RESULTS
A. Grade Factors
The U.S. Department of Agriculture’s Federal Grain Inspection Service (FGIS) has established numerical grades, definitions and standards for measurement of many quality attributes. The attributes which determine the numerical grades for corn are test weight, broken corn and foreign material (BCFM), total damage, and heat damage. The table for “U.S. Corn Grades and Grade Requirements” is provided on page 53 of this report.
SUMMARY: GRADE FACTORS AND MOISTURE
- Average U.S. Aggregate test weight (58.2 lb/bu or 74.9 kg/hl) was higher than in 2014, and 4YA. It was well above the limit for U.S. No. 1 grade corn.
- As in previous years, the average U.S. Aggregate test weight was above the minimum for U.S. No. 1 grade in all ECAs.
- Average U.S. Aggregate broken corn and foreign material (BCFM) (0.8% consisting primarily of broken corn) was the same as in 2014, less than in 2013 and 4YA, and well below the maximum for U.S. No. 1 grade. Low BCFM indicates minimal cleaning required for corn delivered to first handler and should facilitate good aeration during storage.
- BCFM levels in almost all (98.0%) of the corn samples were at or below the maximum of 3% allowed for No. 2 grade.
- Average BCFM, broken corn, and foreign material differed little among the three ECAs.
- Average broken corn in the U.S. Aggregate samples (0.6%) was lower than 4YA.
- Average U.S. Aggregate foreign material (0.2%) was the same as in previous years and 4YA.
- Total damage in the U.S. Aggregate samples averaged 1.4% in 2015, lower than 2014, higher than 4YA, and still well below the limit for U.S. No. 1 grade (3%). Most of the samples (88.2%) contained 3% or less damaged kernels, indicating that the corn should have good quality and store well.
- The Pacific Northwest ECA had the lowest total damage in 2015, 2014, 2013 and 4YA when compared to the Gulf and Southern Rail ECAs. No heat damage was reported on any of the samples.
- Average U.S. Aggregate moisture content in 2015 (15.7%) was lower than 2014, 2013, and 4YA.
- The 2015 average moisture contents for all ECAs were similar – 15.6 to 15.7%.
- The moisture values were distributed with more of the samples containing 15% or less moisture and fewer samples above 17% moisture in 2015 compared to 2014. This moisture distribution indicates that the 2015 crop should require less artificial drying to reach safe storage levels than in 2014, and that the crop should store well.
1One sample in 2015 contained a high level of broken corn (7.5%) and a high level of foreign material (4.5%), resulting in 12% BCFM. A high level of broken corn is evidence of spout-line segregation (separation of whole and broken kernels as they are discharged from a loading spout). The next highest level of BCFM in the 2015 survey was 6.7%. Based on the 2,970 samples tested over the five years of the Harvest Quality Report, the sample with 12% BCFM appears to be an outlier. However, to adhere to the Report’s policy of transparent methodology, the sample was retained in the results.
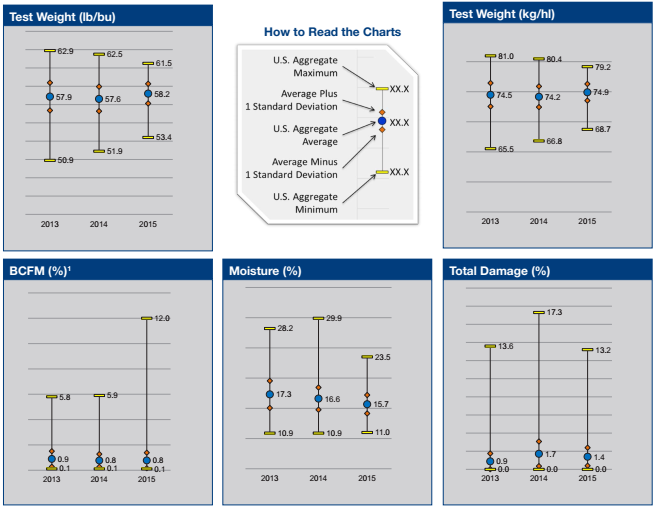
1. Test Weight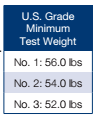
Test weight (weight per volume) is a measure of bulk density and is often used as a general indicator of overall quality and as a gauge of endosperm hardness for alkaline cookers and dry millers. High test weight corn will take up less storage space than the same weight of corn with a lower test weight. Test weight is initially impacted by genetic differences in the structure of the kernel. However, it is also affected by moisture content, method of drying, physical damage to the kernel (broken kernels and scuffed surfaces), foreign material in the sample, kernel size, stress during the growing season, and microbiological damage. When sampled and measured at the point of delivery from the farm at a given moisture content, high test weight generally indicates high quality, high percent of horneous (or hard) endosperm and sound, clean corn. Test weight is positively correlated with true density and reflects kernel hardness and kernel maturity.
RESULTS
- Average U.S. Aggregate test weight in 2015 (58.2 lb/ bu or 74.9 kg/hl) was higher than 2014 (57.6 lb/bu or 74.2 kg/hl), 2013 (57.9 lb/bu or 74.5 kg/hl) and 4YA (58.1 lb/bu or 74.8 kg/hl).
- Average U.S. Aggregate test weight in 2015 was well above the minimum for U.S. No. 1 grade (56 lb/bu).
- U.S. Aggregate test weight standard deviation in 2015 (1.08 lb/bu) was lower than 2014 (1.34 lb/bu), 2013 (1.51 lb/bu) and 4YA (1.39 lb/bu), indicating less variability in 2015 than in previous years.
- The range in values was also smaller among the 2015 harvest samples than the previous two years – 8.1 lb/bu in 2015 compared to 10.6 lb/bu in 2014 and 12.0 lb/bu in 2013.
- The 2015 test weight values were distributed with 94.2% of the samples at or above the factor limit for U.S. No. 1 grade (56 lb/bu) compared to 77% in 2014 and 81% in 2013. In the 2015 crop, 99.4% of the samples were above the limit for U.S. No. 2 grade, compared to 94% in 2014.
- Average test weight was above the limit for U.S. No. 1 grade in all ECAs. The Gulf (58.3 lb/bu) and Southern Rail (58.4 lb/bu) ECAs had the highest average test weights. The Pacific Northwest ECA had the lowest test weight (57.9 lb/bu) in 2015, 2014, 2013 and 4YA.
- Although the Pacific Northwest ECA had the lowest test weight in 2015, it had less variability as indicated by its lower standard deviation (1.02 lb/bu) compared to the Gulf (1.10 lb/bu) and Southern Rail (1.08 lb/bu) ECAs.

2. Broken Corn and Foreign Material (BCFM)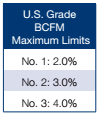
Broken corn and foreign material (BCFM) is an indicator of the amount of clean, sound corn available for feed and processing. The lower the percentage of BCFM, the less foreign material and/or fewer broken kernels are in a sample. Higher levels of BCFM in farm-originated samples generally stem from harvesting practices and/or weed seeds in the field. BCFM levels will normally increase during drying and handling, depending on the methods used and the soundness of the kernels. Increased stress cracks at harvest will also result in an increase in broken kernels and BCFM during subsequent handling.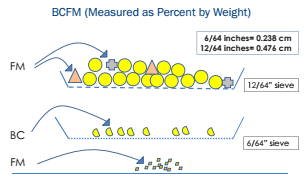
Broken corn is defined as corn and any other material (such as weed seeds) small enough to pass through a 12/64th-inch round-hole sieve, but too large to pass through a 6/64th-inch round-hole sieve.
Foreign material is defined as any non-corn material too large to pass through a 12/64th-inch round-hole sieve, as well as all fine material small enough to pass through a 6/64th-inch round-hole sieve.
The diagram to the right illustrates the measurement of broken corn and foreign material for the U.S. corn grades.
RESULTS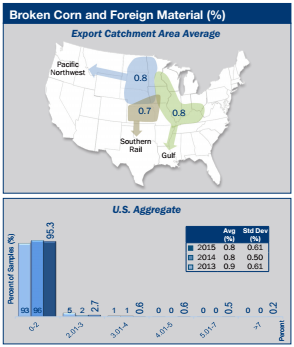
- Average U.S. Aggregate BCFM in 2015 (0.8%) was the same as 2014 (0.8%), less than 2013 (0.9%) and 4YA (0.9%), and well below the maximum for U.S. No. 1 grade (2.0%).
- The variability of BCFM in the 2015 crop was similar to previous years’ crops and 4YA as indicated by standard deviations (0.61% for 2015, 0.50% for 2014, 0.61% for 2013 and 0.58% for 4YA).
- The range between minimum and maximum BCFM values was higher in 2015 (11.9%)1 than in 2014 (5.8%) and 2013 (5.7%).
- The 2015 samples were distributed with 95.3% of the samples below the maximum BCFM level for U.S. No. 1 grade (2%), compared to 96% in 2014 and 93% in 2013. BCFM levels in nearly all samples (98.0%) were at or below the maximum 3% limit for No.2 grade.
- Average BCFM among the ECAs differed by no more than 0.1% in 2015 and by no more than 0.2% for 4YA.
1One sample in 2015 contained a high level of broken corn (7.5%) and a high level of foreign material (4.5%), resulting in 12% BCFM. A high level of broken corn is evidence of spout-line segregation (separation of whole and broken kernels as they are discharged from a loading spout). The next highest level of BCFM in the 2015 survey was 6.7%. Based on the 2,970 samples tested over the five years of the Harvest Quality Report, the sample with 12% BCFM appears to be an outlier. However, to adhere to the Report’s policy of transparent methodology, the sample was retained in the results.
3. Broken Corn
Broken corn in U.S. grades is based on particle size and usually includes a small percent of non-corn material. Broken corn is more subject to mold and insect damage than whole kernels, and it can cause problems in handling and processing. When not spread or stirred in a storage bin, broken corn tends to stay in the center of the bin while whole kernels are likely to gravitate outward to the edges. The center area in which broken corn tends to accumulate is known as a “spout-line.” If desired, the spout-line can be reduced by drawing this grain out of the center of the bin.
RESULTS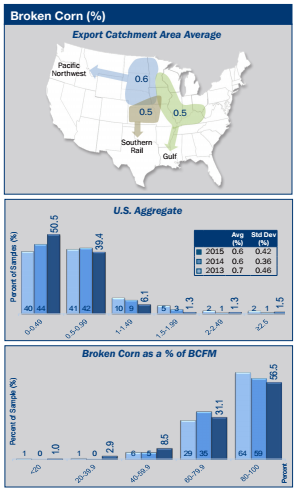
- Broken corn in the U.S. Aggregate samples averaged 0.6% in 2015, the same as 2014, and slightly lower than 2013 (0.7%) and 4YA (0.7%).
- The variability of broken corn for the 2015 crop was similar to previous years and 4YA as measured by standard deviations. Standard deviations for 2015, 2014, 2013, and 4YA were 0.42%, 0.36%, 0.46%, and 0.44%, respectively.
- The range in broken corn values in 2015 (7.5%) was wider than previous years 2014 (3.2%), 2013 (3.8%).
- The 2015 samples were distributed with 50.5% of the samples less than 0.5% broken corn and 89.9% less than 1.0% broken corn. There were more samples in 2015 with low levels of breakage than in the previous two years.
- The percent of broken corn for the Gulf, Pacific Northwest, and Southern Rail ECAs (0.5, 0.6, and 0.5%, respectively) differed by less than 0.1% across the ECAs.
- The distribution chart to the right, displaying broken corn as a percent of BCFM, shows that in nearly all samples, BCFM consisted primarily of broken corn, similar to what was found in previous years.
4. Foreign Material
Foreign material is of importance because it has reduced feed or processing value. It is also generally higher in moisture content than the corn and therefore creates a potential for deterioration of corn quality during storage. Foreign material also contributes to the spout-line and has the possibility of creating more quality problems than broken corn because of the higher moisture level, as mentioned above.
RESULTS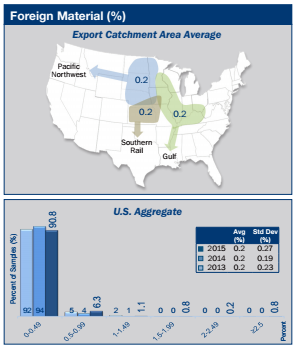
- Foreign material in the U.S. Aggregate samples averaged 0.2% in 2015, the same as 2014, 2013 and 4YA. Combines are designed to remove most fine material, and they appear to be functioning very well, given the consistently low level of foreign material found across the years.
- Variability, measured by standard deviation, among the U.S. Aggregate samples in 2015 (0.27%) was greater than 2014 (0.19%), 2013 (0.23%), and 4YA (0.20%).
- Foreign material in the 2015 samples ranged from 0.0 to 4.5%, compared to 2014 (0.0 to 5.5%) and 2013 (0.0 to 2.5%).
- In the 2015 crop, 90.8% of the samples contained less than 0.5% foreign material, fewer than in 2014 (94%) and 2013 (92%).
- All ECAs had average foreign material values equal to 0.2% in 2015, 2014, and 4YA.
5. Total Damage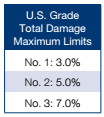
Total damage is the percentage of kernels and pieces of kernels that are visually damaged in some way, including damage from heat, frost, insects, sprouting, disease, weather, ground, germ, and mold. Most of these types of damage result in some sort of discoloration or change in kernel texture. Damage does not include broken pieces of grain that are otherwise normal in appearance.
Mold damage is usually associated with higher moisture content and high temperature in growing and/or storage. Mold damage and the associated potential for mycotoxins is the damage factor of greatest concern. Mold damage can occur prior to harvest as well as during temporary storage at high moisture and high temperature levels before delivery.
RESULTS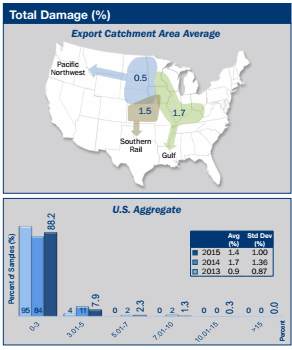
- Average U.S. Aggregate total damage (1.4%) was lower than 2014 (1.7%), but higher than 2013 (0.9%) and 4YA (1.1%). Although higher than 4YA, 2015 total damage was still well below the limit for U.S. No. 1 grade (3%).
- Total damage variability in the 2015 crop (1.00%) was similar to standard deviations for 2014 (1.36%), 2013 (0.87%) and 4YA (0.97%).
- The range for total damage in 2015 (0.0 to 13.2%) was similar to that in 2014 (0.0 to 17.3%) and 2013 (0.0 to 13.6%).
- Total damage in the 2015 samples was distributed with 88.2% of the samples having 3% or less damaged kernels, and 96.1% having 5% or less.
- Average total damage by ECAs was 1.7% for Gulf, 0.5% for Pacific Northwest and 1.5% for Southern Rail ECA. Of the ECAs, the Pacific Northwest had the lowest average total damage for the past 3 years and 4YA.
- Average total damage values in all ECAs were well below the limit for U.S. No. 1 corn (3.0%).
6. Heat Damage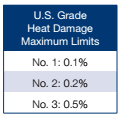
Heat damage is a subset of total damage and has separate allowances in the U.S. Grade standards. Heat damage can be caused by microbiological activity in warm, moist grain or by high heat applied during drying. Heat damage is seldom present in corn delivered at harvest directly from farms.
RESULTS
- There was no heat damage reported in any of the 2015 samples, the same results as 2014, 2013 and 4YA.
- The absence of heat damage likely was due in part to fresh samples coming directly from farm to elevator with minimal prior drying.