V. U.S. CORN PRODUCTION, USAGE AND OUTLOOK
A. U.S. Corn Production1
1. U.S. Average Production and Yields
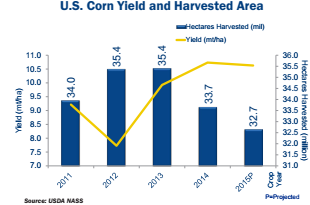
- According to the November 2015 USDA World Agricultural Supply and Demand Estimates (WASDE) report, average U.S. corn yield for the 2015 crop is projected to be 10.6 mt/ha (169.3 bu/ac). This is 0.1 mt/ha (1.7 bu/ac) lower than the 2014 corn crop and the second highest average yield on record.
- The number of hectares harvested in 2015 is projected to be 32.7 million (80.7 mil ac). This is 1.0 mil ha (2.5 mil ac) less than in 2014. The projected 32.7 mil ha harvested in 2015 ranks 11th over the last 80 years and 7th-highest in the past 10 years.
- Total U.S. corn production for 2015 is projected to be 346.8 mmt (13,654 mil bu). This is about 14.3 mmt (562 mil bu) lower than 2014 and the third-largest U.S. corn crop on record.
- While 2015 saw the lowest number of harvested hectares since 2009, the 2015 crop experienced the second-highest average yield on record, thereby producing the third-largest U.S. corn crop on record.
2. ASD and State-Level Production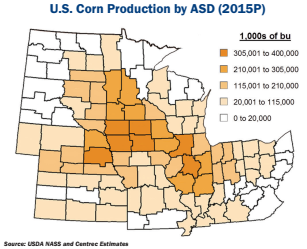
The geographic areas included in the Harvest Report encompass the highest corn-producing areas in the United States. This can be seen on the map showing projected 2015 corn production by USDA Agricultural Statistical District (ASD).
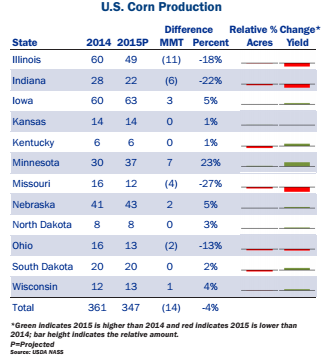
Relative to the record corn crop produced in 2014, the slightly reduced size of the 2015 crop was primarily driven by lower production in Illinois, Indiana, Missouri, and Ohio compared to 2014. Of the remaining eight states, five states produced about the same amount of corn in 2015 as in 2014, and three states had greater production in 2015 than in 2014 (Iowa, Minnesota and Nebraska).
The U.S. Corn Production table summarizes the differences in both quantity (mmt) and percentages between 2014 and projected 2015 corn production for each state. Also included is an indication of the relative changes in harvested acres and yield between 2014 and projected 2015. The green bar indicates a relative increase and the red bar indicates a relative decrease from 2014 to projected 2015. This illustrates that harvested acres were largely unchanged to slightly lower. Yield changes were mixed, with large increases (greater than 10%) in Minnesota and large decreases (greater than 10%) in Illinois, Indiana, Missouri, and Ohio.