
C. Statistical Analysis
The sample test results for the grade factors, moisture, chemical composition, and physical factors were summarized as the U.S. Aggregate and also by three composite groups that supply corn to each of three major export channels, labeled Export Catchment Areas (ECAs), as follows: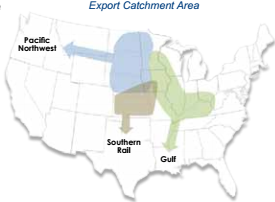
- The Gulf ECA consists of areas that typically export corn through the U.S. Gulf ports;
- The Pacific Northwest (PNW) ECA includes areas that export corn through Pacific Northwest and California ports; and
- The Southern Rail ECA comprises areas generally exporting corn to Mexico.
In analyzing the sample test results, the Council followed the standard statistical techniques employed for proportionate stratified sampling, including weighted averages and standard deviations. In addition to the weighted averages and standard deviations for the U.S. Aggregate, weighted averages and standard deviations were estimated for the composite ECAs. The geographic areas from which exports flow to each of these ECAs overlap due to available transportation modes. Therefore, composite statistics for each ECA were calculated based on estimated proportions of grain flowing to each ECA. As a result, corn samples could be reported in more than one ECA. These estimations were based on industry input, export data, and evaluation of studies of grain flow in the United States.
New to this 2015/2016 Harvest Report is a simple average of the quality factors’ averages and standard deviations of the previous four Harvest Reports (2011/2012, 2012/2013, 2013/2014 and 2014/2015). These simple averages are calculated for the U.S. Aggregate and each of the three ECAs and are referred to as “4YA” in the text and summary tables of the report.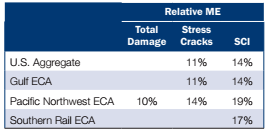
The Relative ME was calculated for each of the quality factors for the U.S. Aggregate and each of the ECAs. The Relative ME was less than ±10% for all the quality attributes except for stress cracks and SCI for the U.S. Aggregate, and the Gulf and Pacific Northwest ECAs, SCI for the Southern Rail ECA, and total damage for the Pacific Northwest ECA. The Relative ME for total damage, stress cracks and SCI are shown in the table to the right.
While the lower level of precision for these quality factors is less than desired, these levels of Relative ME do not invalidate the estimates. Footnotes in the summary tables for “Grade Factors and Moisture” and “Physical Factors” indicate the attributes for which the Relative ME exceeds ±10%.
References in the “Quality Test Results” section to statistical and/or significant differences between 2015 and 2014 and 2015 and 2013 test results were validated by two-tailed t-tests at the 95% confdence level. The t-tests were calculated between results in the 2013/2014 Harvest Report and the 2015/2016 Harvest Report, and the 2014/2015 Harvest Report and the 2015/2016 Harvest Report.