C. Chemical Composition
The chemical composition of corn consists primarily of protein, starch, and oil. These attributes are not grade factors but are of significant interest to end users. They provide additional information related to nutritional value for livestock and poultry feeding, for wet milling uses, and other processing uses of corn. Unlike many physical attributes, chemical composition values are not expected to change significantly during storage or transit.
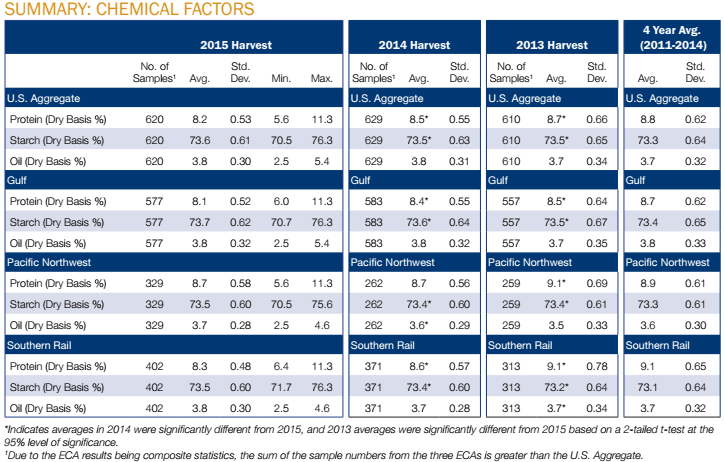
SUMMARY: CHEMICAL COMPOSITION
- The lower average U.S. Aggregate protein concentration in 2015 (8.2% dry basis) and 2014 compared to 4YA is likely attributable to higher yields in 2015 and 2014 than in the previous three years. During the 2015 and 2014 growing seasons, available nitrogen was distributed over more bushels per acre (or more metric tons per hectare) of corn, causing protein concentrations to be lower than in 2013.
- The Gulf ECA had lower protein concentrations than the other ECAs in 2015, 2014, 2013, and 4YA.
- Average U.S. Aggregate starch concentration in 2015 (73.6% dry basis) was higher than 2014, 2013, and 4YA. The higher starch in 2015, resulting in part from good growing and kernel filling conditions, should be desirable for corn wet milling.
- The Gulf ECA had higher starch concentrations than the other ECAs in 2015, 2014, 2013, and 4YA.
- Average U.S. Aggregate oil concentration (3.8% dry basis) was the same as 2014 but higher than 2013 and 4YA.
- Oil concentration averages were higher for the Gulf and Southern Rail ECAs than for the Pacific Northwest ECA in 2015, 2014, 2013, and 4YA.
- Chemical composition was less variable in 2015 than in the previous two years (based on lower standard deviations for protein, starch, and oil).
1. Protein
Protein is very important for poultry and livestock feeding. It supplies essential sulfur-containing amino acids and helps to improve feed conversion efficiency. Protein tends to decrease with decreased available soil nitrogen and in years with high crop yields. Protein is usually inversely related to starch concentration. Results are reported on a dry basis.
RESULTS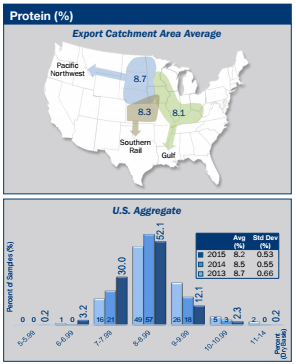
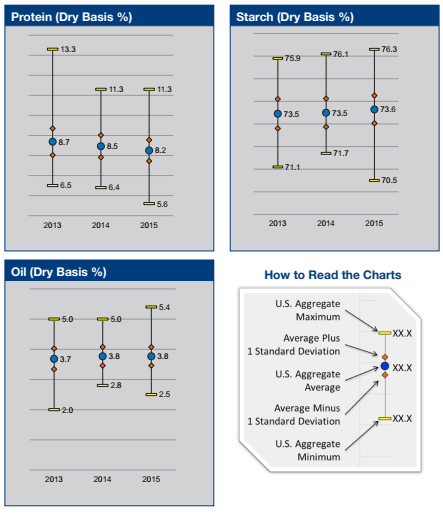
- In 2015, U.S. Aggregate protein concentration averaged 8.2%, lower than 2014 (8.5%), 2013 (8.7%), and 4YA (8.8%).
- U.S. Aggregate protein standard deviation in 2015 (0.53%) was lower than 2014 (0.55%), 2013 (0.66%), and 4YA (0.62%). Protein concentration range in 2015 (5.6 to 11.3%) was intermediate to the range in 2014 (6.4 to 11.3%) and 2013 (6.5 to 13.3%).
- Protein concentrations in 2015 were distributed with 33.4% below 8.0%, 52.1% between 8.0 and 8.99%, and 14.6% at or above 9.0%. The protein distribution in 2015 shows fewer samples with high levels of protein than in 2014 or 2013.
- Protein concentration averages for Gulf, Pacific Northwest, and Southern Rail ECAs were 8.1%, 8.7%, and 8.3%, respectively. The Gulf ECA had the lowest protein for 2015, 2014, 2013, and 4YA.
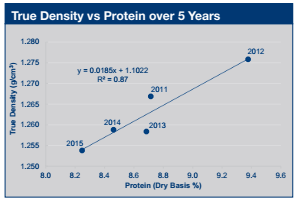
- Based on U.S. Aggregate averages over the past five years, protein concentration tends to increase as true density increases, as shown in the figure to the right (a correlation coefficient of 0.93). Protein concentration appears to be lower in years with lower true density (2015) and higher in years with higher true density (2012).
- Over the past five crop years, 11 of the 12 states surveyed have shown a negative relationship between average state corn yield and average state protein concentration. In general, when their average yield has increased, average protein concentration has decreased.
2. Starch
Starch is an important factor for corn used by wet millers and dry-grind ethanol manufacturers. High starch concentration is often indicative of good kernel growing/filling conditions and reasonably moderate kernel densities. Starch is usually inversely related to protein concentration. Results are reported on a dry basis.
RESULTS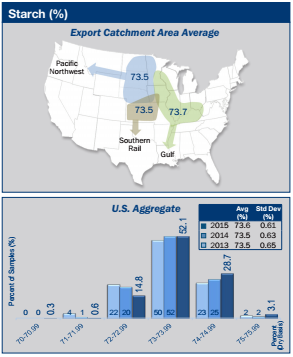
- U.S. Aggregate starch concentration averaged 73.6% in 2015, higher than 73.5% in both 2014 and 2013, and 73.3% for 4YA. U.S. Aggregate starch standard deviation in 2015 (0.61%) was lower than 2014 (0.63%), 2013 (0.65%), and 4YA (0.64%).
- Starch concentration range in 2015 (70.5 to 76.3%) was similar to 2014 (71.7 to 76.1%) and 2013 (71.1 to 75.9%).
- Starch concentrations in 2015 were distributed with 15.7% of the samples at 72.99% or lower, 52.1% between 73.0 and 73.99%, and 31.8% at 74.0% and higher. The distribution shows more samples had higher levels of starch in 2015 than in 2014 and 2013. The higher concentrations of starch in 2015 were likely due in part to a high percentage of the crop having near 75% good-to-excellent crop growing conditions and low plant stress during the grain filling period.
- Starch concentration averages for the Gulf, Pacific Northwest, and Southern Rail ECAs were 73.7%, 73.5% and 73.5%, respectively. Starch concentration averages were highest in the Gulf ECA in 2015, 2014, 2013 and 4YA. Thus, the Gulf ECA had highest starch and lowest protein in each of the last three years and 4YA.
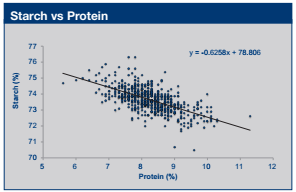
- Since starch and protein are the two largest components in corn, when the percentage of one goes up, the other usually goes down. This relationship is illustrated in the adjacent figure showing a weak but negative correlation (-0.62) between starch and protein.
3. Oil
Oil is an essential component of poultry and livestock rations. It serves as an energy source, enables fat-soluble vitamins to be utilized, and provides certain essential fatty acids. Oil is also an important co-product of corn wet and dry milling. Results are reported on a dry basis.
RESULTS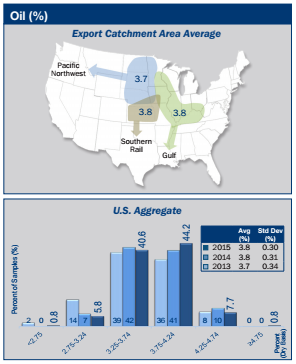
- Average U.S. Aggregate oil concentration (3.8%) in 2015 was the same as 2014, but higher than 2013 (3.7%) and 4YA (3.7%).
- U.S. Aggregate oil standard deviation in 2015 (0.30%) was lower than 2014 (0.31%), 2013 (0.34%), and 4YA (0.32%).
- Oil concentration range in 2015 (2.5 to 5.4%) was similar to 2014 (2.8 to 5.0%) and 2013 (2.0 to 5.0%).
- Oil concentrations in 2015 were distributed with 47.2% of the samples at 3.74% or lower, 44.2% of samples at 3.75% to 4.24%, and 8.5% at 4.25% and higher. The distribution shows slightly more samples had higher oil levels in 2015 than in 2014 or 2013.
- Oil concentration averages for Gulf, Pacific Northwest, and Southern Rail ECAs were 3.8%, 3.7%, and 3.8%, respectively. Oil concentration averages were higher for the Gulf and Southern Rail ECAs than for the Pacific Northwest for 2015, 2014, 2013 and 4YA.