C. Chemical Composition
The components of protein, starch and oil are related to corn’s nutritional value for livestock and poultry feeding, for wet milling uses, and other processing uses of corn. The relative value of these components varies for different uses of corn. In general, starch and protein have an inverse relationship in corn – more of one means less of the other. Unlike many physical attributes, chemical composition values were not expected to change significantly during storage or transport.
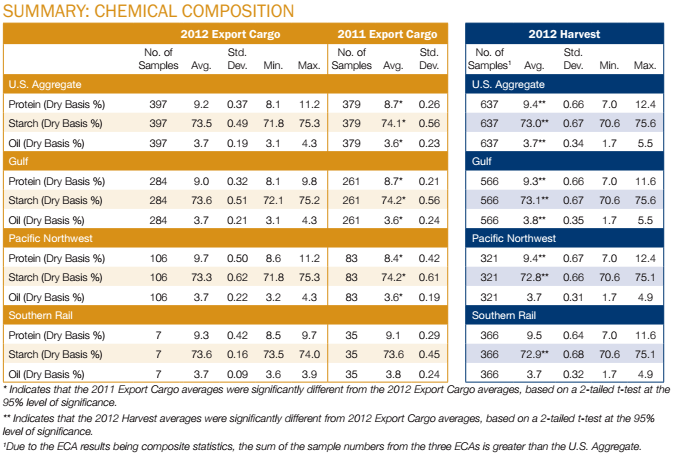
SUMMARY: CHEMICAL COMPOSITION
- Protein content in 2012/13 export samples averaged 9.2% and was significantly higher than the 8.7% found for the 2011/12 export samples.
- Protein was significantly higher for samples from the Pacific Northwest than those at the Gulf and Southern Rail.
- Starch content averaged 73.5% in 2012/13 and was lower than the 74.1% found in the 2011/12 samples.
- Oil content (3.7%) in the 2012/13 samples was higher than the 3.6% found for the 2011/12 export samples and was the same across all ECAs.
- Protein, starch and oil all had narrower ranges and lower standard deviations at export than at the harvest level.
1. Protein
Protein is very important for poultry and livestock feeding. It helps with feeding efficiency and supplies essential sulfur-containing amino acids. Protein is usually inversely related to starch content. Results are reported on a dry basis.
HIGHLIGHTS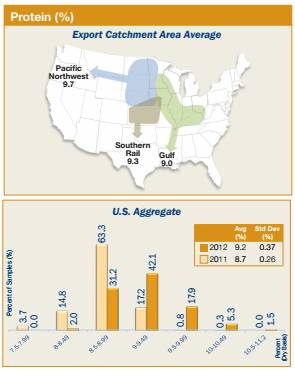
- U.S. Aggregate protein in 2012/13 was 9.2%, significantly higher than the 8.7% found in the 2011/12 samples.
- The protein content at export (9.2%) was lower than at harvest (9.4%). However, protein content at export (standard deviation of 0.37%) was more uniform than at harvest (standard deviation of 0.66%).
- Protein content in 2012/13 export samples was distributed with 67% at or above 9%, compared to 18% of the 2011/12 export samples.
- The Pacific Northwest ECA had higher average protein than that found at the Gulf and Southern Rail ECAs.
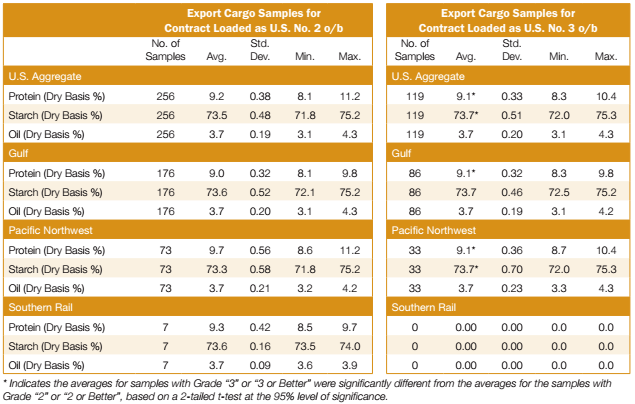
- Protein averages were slightly higher for contracts loaded as U.S. No. 2 o/b (9.2%) than those loaded as U.S. No. 3 o/b (9.1%).
2. Starch
Starch is an important factor for corn used by wet millers and dry-grind ethanol manufacturers. High starch content is often indicative of good kernel maturation/filling conditions and reasonably high kernel densities. Starch is usually inversely related to protein content. Results are reported on a dry basis.
HIGHLIGHTS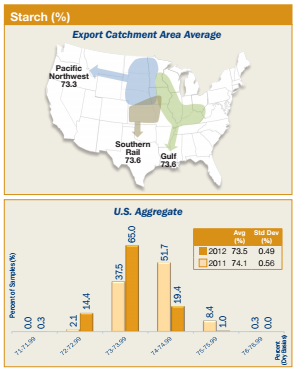
- U.S. Aggregate starch in 2012/13 was 73.5%, lower than the 74.1% found in the 2011/12 samples.
- The starch level at export (73.5%) was higher than at harvest (73.0%). However, starch content at export (standard deviation of 0.49%) was more uniform with a slightly lower standard deviation, than in the harvest samples (standard deviation of 0.67%).
- Gulf samples were significantly higher in starch than the Pacific Northwest samples. Note that starch and protein contents were both inversely related and significantly different between the Gulf and Pacific Northwest.
- Starch in contracts loaded as U.S. No. 2 o/b (73.5%) was lower than in contracts loaded as U.S. No. 3 o/b (73.7%). This is the opposite for protein and consistent with the inverse relationship between starch and protein.
3. Oil
Oil is an essential component of poultry and livestock rations. It serves as an energy source, enables fat-soluble vitamins to be utilized, and provides certain essential fatty acids. Oil is also an important by-product of corn wet and dry milling. Results are reported on a dry basis.
HIGHLIGHTS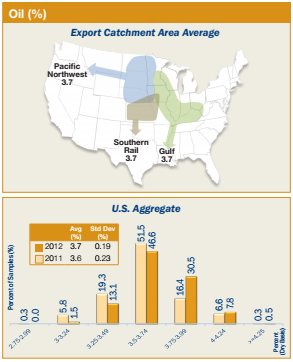
- U.S. Aggregate oil content in 2012/13 was 3.7%, higher than the 3.6% in 2011/12.
- The average oil content at export (3.7%) was unchanged from harvest for the 2012 crop. However, oil content at export (standard deviation of 0.19%) was more uniform with a slightly lower standard deviation than at harvest (standard deviation of 0.34%).
- Oil averages for the Gulf, Pacific Northwest, and Southern Rail ECAs were each 3.7%. About 85% of the 2012/13 export samples contained at least 3.5% oil, in contrast to 75% of the 2011/12 export samples.
- The average oil content for contracts loaded as U.S. No. 2 o/b was 3.7% which was the same as for contracts loaded as U.S. No. 3 o/b.