
B. Survey Design and Sampling
1. Survey Design
For this Export Cargo Report, the target population was yellow commodity corn from the twelve key U.S. corn-producing states representing about 99% of U.S. corn exports. A proportionate stratified sampling technique was used to ensure a sound statistical sampling of U.S. yellow corn exports. Two key characteristics define the sampling technique for this report: the stratification of the population to be sampled and the sampling proportion per subpopulation or stratum.
Stratification involves dividing the survey population of interest into subpopulations called strata. For the Export Cargo Reports, the key corn-exporting areas in the U.S. are divided into three geographical groupings which we refer to as Export Catchment Areas (ECAs). These three ECAs are identified by the three major pathways to export markets: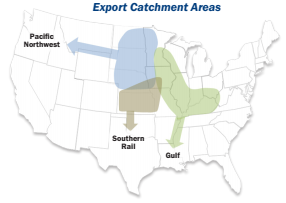
1. The Gulf ECA consists of areas that typically export corn through U.S. Gulf ports;
2. The Pacific Northwest ECA includes areas exporting corn through Pacific Northwest and California ports; and
3. The Southern Rail ECA comprises areas generally exporting corn by rail to Mexico.
Using data from the FGIS Export Grain Information System (EGIS), each ECA’s proportion of the total annual yellow corn exports for the 2010/11 and 2011/12 corn marketing years was calculated and averaged over the two marketing years. This average share of exports was used to determine the sampling proportion (the percent of total samples per ECA) and, ultimately, the number of yellow corn samples to be collected from each ECA. The specified sampling proportions for the three ECAs are as follows: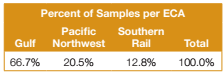
The number of samples collected within each ECA was established so the Council could estimate the true averages of the various quality factors with a certain level of precision. The level of precision chosen for the Export Cargo Report was a relative margin of error (Relative ME) no greater than ± 10%. A Relative ME of ± 10% is a reasonable target for biological data such as these corn quality factors.
To determine the number of samples for the targeted Relative ME, ideally the population variance (i.e., variability of the quality factor in the corn exports) for each of the quality factors should be used. The more variation among the levels or values of a quality factor, the more samples needed to estimate the true mean with a given confdence limit. In addition, the variances of the quality factors typically differ from one another. As a result, different sample sizes for each of the quality factors would be needed for the same level of precision.
Since the population variances for the 15 quality factors evaluated for this year’s corn exports were not known, the variance estimates from last year’s Export Cargo Report were used as estimates of the population variance. The variances and ultimately the estimated number of samples needed for the Relative ME of ± 10% for 12 quality factors were calculated using the 2011/12 results of 379 samples. Heat damage, 100-k weight, and kernel volume were not examined. Based on these data, a total sample size of 426 would allow the Council to estimate the true averages of the quality characteristics with the desired level of precision for the U.S. Aggregate. Applying the sampling proportions previously defined to the total of 426 samples resulted in the following number of targeted samples from each ECA: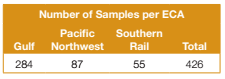
2. Sampling
The sampling was administered by FGIS and participating official service providers as part of their inspection services. Based on feedback from the FGIS field offices indicating that 2012 corn was reaching export points by mid-October 2012, it was decided to start the sampling period the latter part of October 2012. Therefore, instruction letters were sent to field offices and the domestic inspections office by FGIS on October 22, 2012, and the sampling period began October 22, 2012, for the Gulf and Pacific Northwest ECAs and October 29, 2012, for the Southern Rail ECA. The FGIS field offices in the respective ECAs responsible for overseeing the sample collection within their region were as follows: Gulf – New Orleans, Louisiana; Pacific Northwest – Olympia, Washington (Washington State Department of Agriculture); and Southern Rail – FGIS Domestic Inspection Operations Office in Kansas City, Missouri.
Representative sublot samples from the ports in the Gulf and Pacific Northwest ECAs were collected as ships were loaded, and only lots for which quantitative aflatoxin testing was being performed were to be sampled. Samples for grading are obtained by a diverter sampling device approved by FGIS. The diverter sampler “cuts” (or diverts) a representative portion at periodic intervals from a moving stream of corn. A cut occurs every few seconds, or about every 500 bushels (about 12.7 metric tons) as the grain is being assembled for export. The frequency is regulated by an electric timer controlled by official inspection personnel, who periodically determine that the mechanical sampler is functioning properly.
While the sampling process is continuous throughout loading, a shipment or “lot” of corn is divided into “sublots” for the purpose of determining uniformity of quality. Sublot size is based on the hourly loading rate of the elevator and the capacity of the vessel being loaded. Sublot sizes range from 60,000 to 100,000 bushels. All sublot samples are inspected to ensure the entire shipment is uniform in quality.
The same sampling frequency for the Pacific Northwest and Gulf ECAs as last year’s export cargo survey was used for this year’s survey. Therefore, sublots ending in 0, 3, 5 and 7 from each lot during the survey period were sampled.
For the Southern Rail samples, a representative sample was taken at domestic interior elevators using a diverter sampler to ensure uniform sampling. A cut is taken about every 500 bushels. After collecting samples from five consecutive rail cars, a five-car composite sample was made from unit trains consisting of 100 rail cars of yellow corn inspected for export to Mexico and for which quantitative aflatoxin testing was being performed.
For each sample, a minimum of 2700 grams was collected by the FGIS field staff, the Southern Rail ECA official service providers, and the Washington State Department of Agriculture, congregated at the field offices, and mailed to Illinois Crop Improvement Association’s Identity Preserved Grain Laboratory (IPG Lab). Refer to the “Testing Analysis Methods” section for the description of the testing methods employed for the study.
The sampling period ended February 4, 2013, for the Pacific Northwest ECA and February 14, 2013, for the Gulf ECA when the targeted number of samples per ECA was reached. In the Southern Rail ECA, the sampling criteria were based on the number of rail cars in and the pattern of historical rail shipments from the interior. However, interior rail shipments during the sampling period were different than in recent marketing years, resulting in very few unit trains containing corn being exported. Adjustments to the sampling criteria were made in February 2013 to account for the different sizes of rail shipments and to expand the options for collecting Southern Rail samples. Unfortunately, the adjustments did not generate additional samples, and as of March 18, 2013, no additional shipments from which samples could be collected were expected for the Southern Rail in the near future. Therefore, in order to publish the Export Cargo Report in a timely manner, the sampling period for the Southern Rail ECA concluded in February 2013.