Physical Factors
Physical factors are other quality attributes that are neither grade factors nor chemical composition. Physical factors include stress cracks, kernel weight, kernel volume, true density, percent whole kernels and percent horneous (hard) endosperm. Tests for these physical factors provide additional information about the processing characteristics of corn for various uses, as well as corn’s storability and potential for breakage in handling. The physical composition of the corn kernel influences the quality attributes; which is, in turn, affected by genetics and growing and handling conditions.
Corn kernels are made up of four parts: the germ or embryo, the tip cap, the pericarp or outer covering and the endosperm. The endosperm represents about 82% of the kernel and consists of soft (also referred to as floury or opaque) endosperm and of horneous (also called hard or vitreous) endosperm, as shown above. The endosperm contains primarily starch and protein, the germ contains oil and some protein, and the pericarp and tip cap are mostly fiber.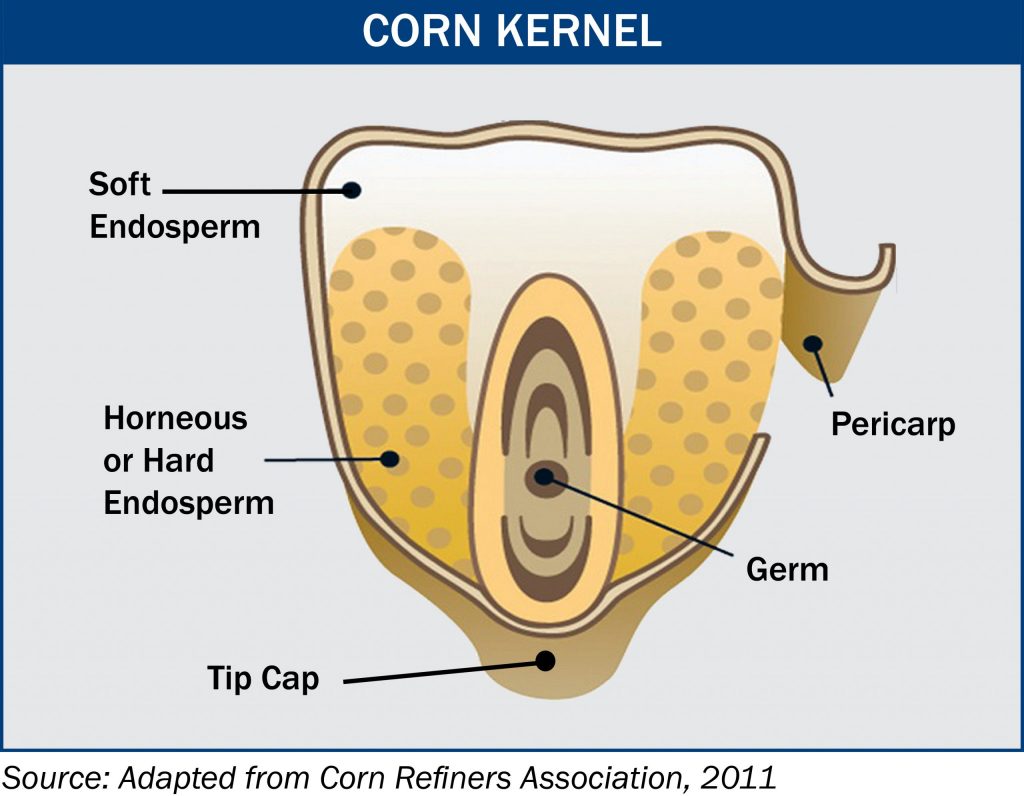
Summary: Physical Factors
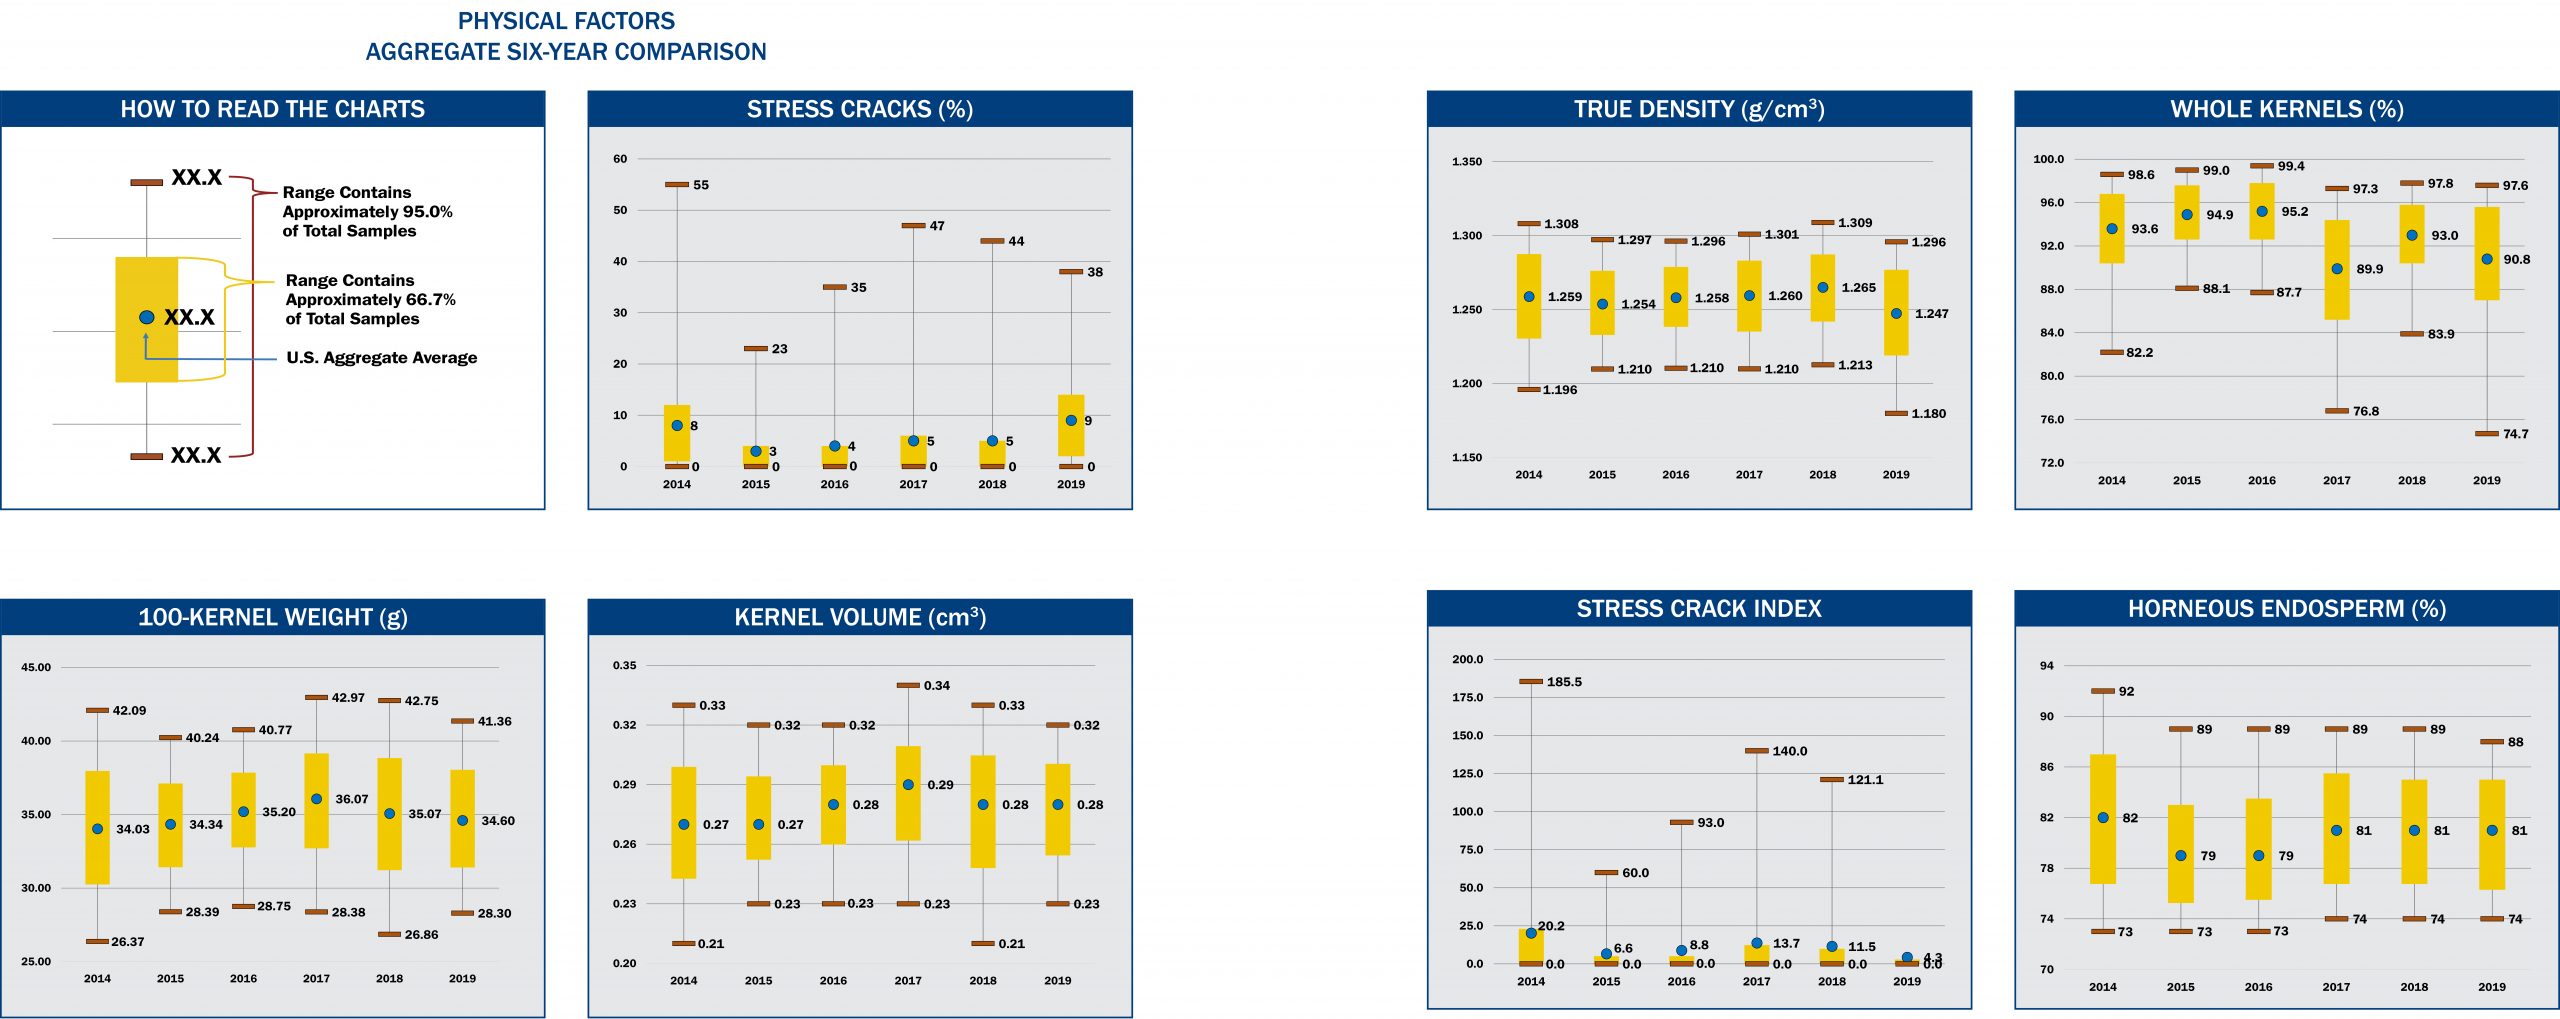
- Average U.S. Aggregate stress cracks (9%) was higher than 2018, 2017 and 5YA (all 5%), indicating susceptibility to breakage in 2019 may be higher than 2018, 2017 and the 5YA.
- Among the ECAs, the Gulf, Pacific Northwest and Southern Rail ECA had stress crack averages of 10, 9 and 6%, respectively. The Southern Rail has had the lowest stress crack averages in 2019, 2018, 2017 and 5YA among all ECAs.
- Average U.S. Aggregate 100-k weight in 2019 (34.60 g) was lower than 2018 (35.07 g), 2017 (36.07 g) and the 5YA (34.94 g).
- Average U.S. Aggregate kernel volume in 2019 (0.28 cm3) was the same as 2018 and 5YA (both 0.28 cm3) and lower than 2017 (0.29 cm3).
- The Pacific Northwest ECA had the lowest average 100-k weight and the lowest kernel volume of the ECAs in 2019, 2018, 2017 and the 5YA.
- U.S. Aggregate kernel true density averaged 1.247 g/cm3 in 2019, which was lower than 2018, 2017 and the 5YA. True density kernel distributions above 1.275 g/cm3 in 2019 indicate softer corn than 2018 and 2017. Of the ECAs, the Pacific Northwest had the lowest true density and lowest test weights in 2019, 2018, 2017 and the 5YA.
- U.S. Aggregate whole kernels averaged 90.8% in 2019, lower than 2018 (93.0%) and the 5YA (93.3%), but higher than in 2017 (89.9%).
- Average U.S. Aggregate horneous (hard) endosperm in 2019 (81%) was the same as 2018 and 2017, but higher than the 5YA (80%). The Southern Rail ECA has had the highest or tied for the highest average horneous endosperm in 2019, 2018, 2017 and 5YA among all ECAs. Average horneous endosperm tends to increase in years with higher true density.