
Survey and Sampling
 The key points for the survey design, sampling methodology and statistical analysis for this 2019/2020 Harvest Report are as follows:
- Following the methodology developed for the previous eight Harvest Reports, the samples were proportionately stratified according to ASDs across 12 key corn-producing states representing over 90% of U.S. corn exports.
- A total of 605 samples collected from the 12 states was targeted to achieve a maximum ±10.0% relative margin of error (Relative ME)
at the 95.0% confidence level. - A total of 623 unblended corn samples pulled from inbound farm-originated trucks were received and tested from local elevators from August 30 through December 3, 2019.
- The mycotoxin testing across the ASDs in the 12 states surveyed for the other quality factors used a proportionate stratified sampling technique. This sampling resulted in testing 180 samples for aflatoxin, DON and fumonisin.
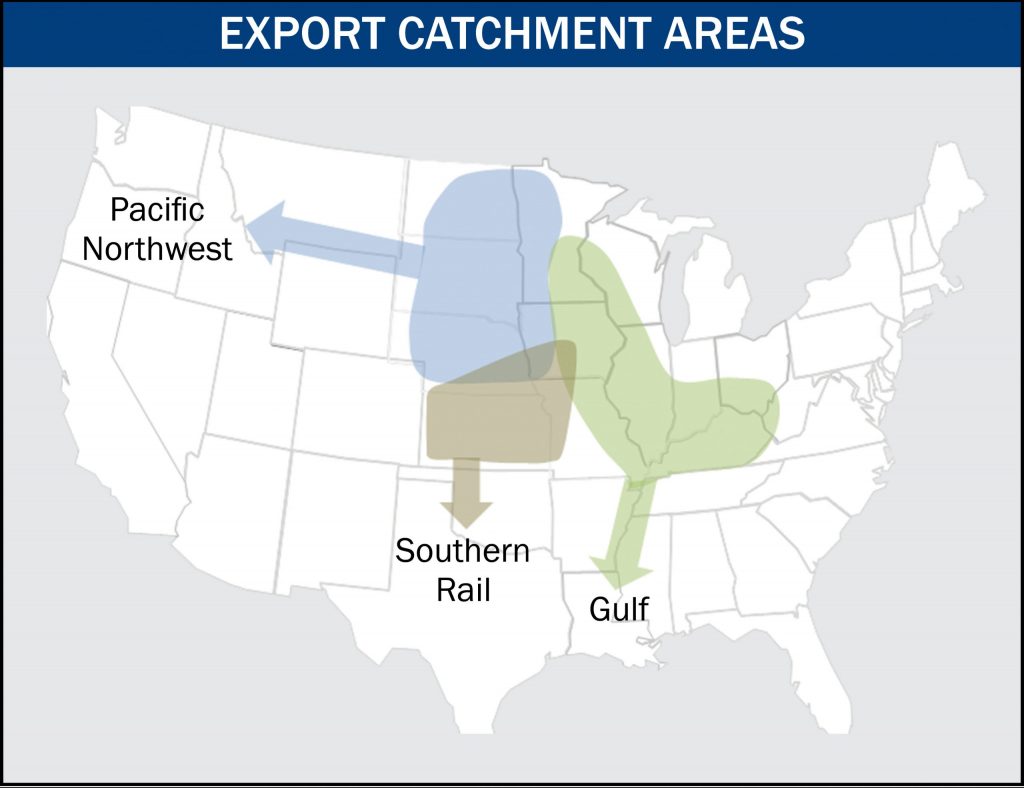
- Weighted averages and standard deviations following standard statistical techniques for proportionate stratified sampling were calculated for the U.S. Aggregate and the three ECAs.
- Each quality factor’s relative margin of error was calculated for the U.S. Aggregate and each of the three ECAs to evaluate the statistical validity of the samples. No quality factors had a relative margin of error above ±10.0% for the U.S. Aggregate. However, the relative margin of error for total damage was 12.6% for the Pacific Northwest ECA. While this level of precision is less than desired, this relative margin of error does not invalidate the estimate.
- Two-tailed t-tests at the 95.0% confidence level were calculated to measure statistical differences between 2019 and 2018 and the 2019 and 2017 quality factor averages.
Survey Design
For this 2019/2020 Harvest Report, the target population was yellow corn from the 12 key U.S. corn-producing states representing over 90% of U.S. corn exports.1 A proportionate stratified, random sampling technique was applied to ensure a sound statistical sampling of the U.S. corn crop at the first stage of the marketing channel. Three key characteristics define the sampling technique: the stratification of the population to be sampled, the sampling proportion per stratum and the random sample selection procedure.
Stratification involves dividing the survey population of interest into distinct, non-overlapping subpopulations called strata. For this study, the survey population was corn produced in areas likely to export corn to foreign markets. The USDA divides each state into several ASDs and estimates corn production for each ASD. The USDA corn production data, accompanied by foreign export estimates, were used to define the survey population in the 12 key corn-producing states. The ASDs were the subpopulations or strata used for this corn quality survey. From those data, the Council calculated each ASD’s proportion of the total production and foreign exports to determine the sampling proportion (the percent of total samples per ASD) and, ultimately, the number of corn samples to be collected from each ASD. The number of samples collected for the 2019/2020 Harvest Report differed among the ASDs, due to their different shares of estimated production and foreign export levels.
Establishing the number of samples collected allowed the Council to estimate the true averages of the various quality factors with a certain level of precision. The level of precision chosen for the 2019/2020 Harvest Report was a relative margin of error no greater than ±10.0%, estimated at a 95.0% level of confidence. A relative margin of error of ±10.0% is a reasonable target for biological data such as these corn quality factors.
To determine the number of samples for the relative margin of error target, ideally, the population variance (i.e., the variability of the quality factor in the corn at harvest) for each of the quality factors should be used. The more variation among the levels or values of a quality factor, the more samples needed to estimate the true mean with a given confidence limit. In addition, the variances of the quality factors typically differ from one another. Therefore, different sample sizes would be needed for each of the quality factors for the same level of precision.
Since the population variances for the 17 quality factors evaluated for this year’s corn crop were not known, the variance estimates from the 2018/2019 Harvest Report were used as proxies. The variances and ultimately, the estimated number of samples needed for the relative margin of error of ±10.0% for 14 quality factors were calculated using the 2018 results of 618 samples. Broken corn, foreign material and heat damage were not examined. Based on these data, a minimum sample size of 600 would allow the Council to estimate the true averages of the quality characteristics with the desired level of precision for the U.S. Aggregate. Due to the rounding of the targeted number of samples per ASD and the criterion of a minimum of two samples per ASD, the targeted number of samples for the 2019 report became 605.
While the relative margin of error for stress cracks was not higher than ±10.0% in the 2018 results for the U.S. Aggregate, this quality factor has had a relative margin of error slightly higher than ±10.0% in three of the eight previous reports. Given the 2019 report’s sample size and the unpredictability of this quality factor’s variance, there was the potential that stress cracks may not meet the targeted level of precision for the U.S. Aggregate. However, the relative margin of error for stress cracks has never been above 12% in the past reports.
The testing of the grade, moisture, chemical and physical characteristics used the same approach of proportionate stratified sampling for the mycotoxin testing of the corn samples. In addition to using the same sampling approach, the same level of precision of a relative margin of error of ±10.0%, estimated at a 95.0% level of confidence, was desired.
Testing at least 25.0% of the minimum number of samples (600) was estimated to provide that level of precision. In other words, testing at least 150 samples would provide a 95.0% confidence level that the percent of tested samples with aflatoxin results below the FDA action level of 20.0 ppb and the percent of tested samples with DON results below the FDA advisory level of 5.0 ppm would have a relative margin of error of ±10.0%. There was no targeted level of precision for fumonisin for this year’s report, as past data on the mycotoxin’s variance were not available. The proportionate stratified sampling approach also required testing at least one sample from each ASD in the sampling area. To meet the sampling criteria of testing 25% of the minimum number of samples (600) and at least one sample from each ASD, the targeted number of samples to test for mycotoxins was 180 samples.
Beginning with the 2019/2020 Harvest Report, only the samples tested for the mycotoxin would be tested for horneous endosperm. This quality factor’s relative margin of error has never exceeded 0.4%, well below the targeted level of precision of ±10.0%, in the samples tested from the eight previous reports. Thus, reducing the number of samples tested for horneous endosperm would likely keep the precision of this quality factor’s estimates well below the targeted level of ±10.0%.
Sampling
Soliciting local grain elevators in the 12 states by email and phone provided the random selection process. Postage-paid sample kits were mailed to elevators agreeing to provide the 2,050-gram to 2,250-gram corn samples requested. Elevators were told to avoid sampling loads of old crop corn from farmers cleaning out their bins for the current crop. The individual samples were pulled from inbound farm-originated trucks when the trucks underwent the elevators’ normal testing procedures. The number of samples each elevator provided for the survey depended on the targeted number of samples needed from the ASD along with the number of elevators willing to provide samples. However, each sampling kit mailed to the participating locations contained bags to collect a maximum of four samples to ensure geographic variation in the samples collected. A total of 623 unblended corn samples pulled from inbound farm-originated trucks were received and tested from local elevators. The participating elevators indicated that these samples were pulled from inbound farm-originated trucks from August 30 through December 3, 2019, by writing the collection date on each sample bag.