
Kernel True Density
Kernel true density is calculated as the weight of a 100-k sample divided by the volume, or displacement, of those 100 kernels and reported as grams per cubic centimeter (g/cm3). True density is a relative indicator of kernel hardness, which is useful for alkaline processors and dry millers. True density may be affected by the genetics of the corn hybrid and the growing environment. Corn with a higher density is typically less susceptible to breakage in handling than lower density corn but is also more at risk for the development of stress cracks if high-temperature drying is employed. True densities above 1.30 g/cm3 indicate very hard corn, which is typically desirable for dry milling and alkaline processing. True densities near the 1.275 g/cm3 level and below tend to be softer and process well for wet milling and feed use.
Results
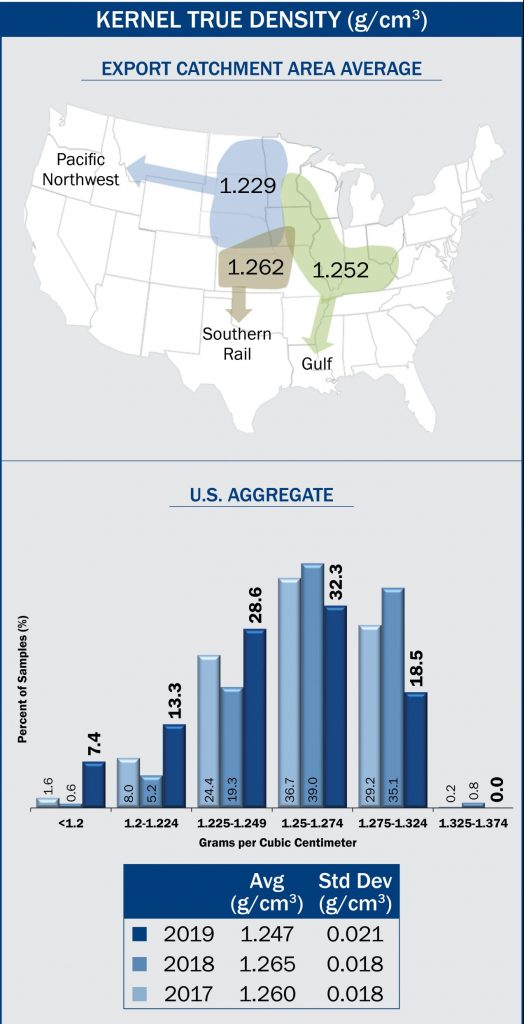 Average U.S. Aggregate kernel true density in 2019 (1.247 g/cm3) was lower than 2018 (1.265 g/cm3), 2017 (1.260 g/cm3) and the 5YA (1.259 g/cm3). Over the past nine years, true densities have tended to be higher in years with higher protein.
- Variability, based on the standard deviation, in 2019 (0.021 g/cm3) was higher than 2018, 2017 and the 5YA (all 0.018 g/cm3).
- True densities in 2019 ranged from 1.116 to 1.322 g/cm3 compared to 2018 (1.167 to 1.374 g/cm3) and 2017 (1.135 to 1.332 g/cm3).
- About 18.5% of the 2019 samples had true densities at or above 1.275 g/cm3 compared to 35.9% in 2018 and 29.4% in 2017. Since corn with values above 1.275 g/cm3 is often considered to represent hard corn and values below 1.275 g/cm3 are often considered to represent soft corn, this kernel distribution indicates softer corn in 2019 than in 2018 and 2017.
- Kernel true densities for the Gulf, Pacific Northwest and Southern Rail ECAs averaged 1.252, 1.229 and 1.262 g/cm3, respectively. The Pacific Northwest ECA’s average true density and test weight were lower than the other ECAs’ values in 2019, 2018, 2017 and the 5YA.
- Test weight, also known as bulk density, is based on the amount of mass contained in a quart cup. While test weight is influenced by true density, as shown in the adjacent figure (resulting in a correlation coefficient of 0.83), it is also affected by moisture content, pericarp damage (whole kernels), breakage and other factors. In 2019, test weight was 57.3 lb/bu, which was lower than 2018 and 2017 (both 58.4 lb/bu). Thus, both true density and bulk density averages were lower in 2019 than in the two previous years and 5YA.