
Whole Kernels
Though the name suggests some inverse relationship between whole kernels and BCFM, the whole kernels test conveys different information than the broken corn portion of the BCFM test. Broken corn is defined solely by the size of the material. Whole kernels, as the name implies, is the percent of fully intact kernels in the sample with no pericarp damage or kernel pieces chipped away.
The exterior integrity of the corn kernel is very important for two key reasons. First, it affects water absorption for alkaline cooking and steeping operations. Kernel nicks or pericarp cracks allow water to enter the kernel faster than intact or whole kernels. Too much water uptake during cooking can result in loss of soluble, non-uniform cooking, expensive shutdown time, or products that do not meet specifications. Some companies pay contracted premiums for corn delivered above a specified level of whole kernels.
Second, intact whole kernels are less susceptible to storage molds and breakage in handling. While hard endosperm lends itself to the preservation of more whole kernels than soft corn, the primary factor in delivering whole kernels is harvesting and handling. This begins with proper combine adjustment followed by the severity of kernel impacts due to conveyors and the number of handlings required from the farm field to the end-user. Each subsequent handling will generate additional breakage. Actual amounts of breakage increase exponentially as moisture decreases, drop heights increase, or a kernel’s velocity at impact increases.4 In addition, harvesting at the higher moisture content (e.g., greater than 25%) will usually lead to soft pericarps and more pericarp damage to corn than when harvesting at lower moisture levels.
Results
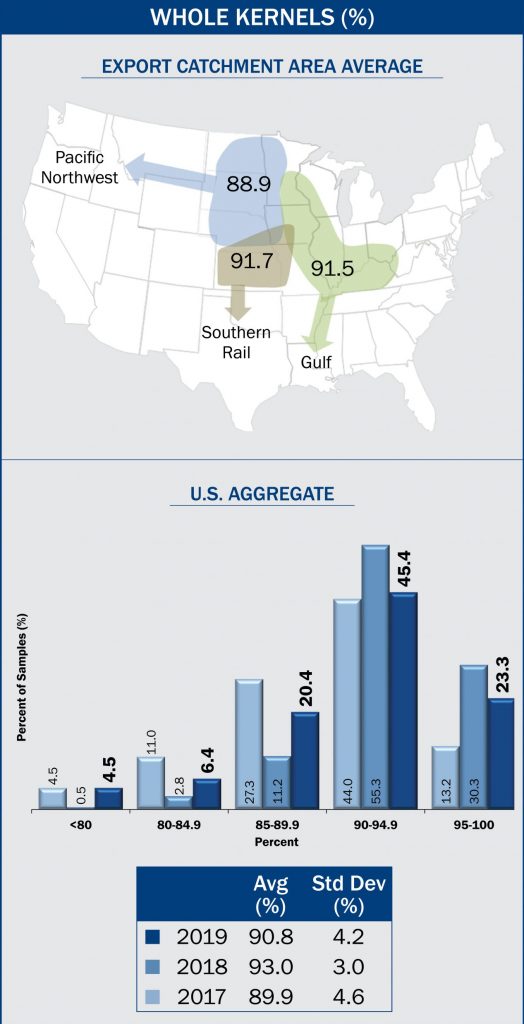 U.S. Aggregate whole kernels averaged 90.8% in 2019, lower than 2018 (93.0%) and the 5YA (93.3%), but higher than 2017 (89.9%),
- The 2019 whole kernel standard deviation (4.2%) was higher than in 2018 (3.0%) and the 5YA (3.3%), but lower than in 2017 (4.6%).
- Whole kernel range in 2019 (25.4 to 99.6%) was much greater than 2018 (66.0 to 98.6%) and 2017 (67.0 to 99.2%).
- Of the 2019 samples, 68.7% had 90.0% or higher whole kernels, compared to 2018 (85.6%) and 2017 (57.2%). This distribution indicates that 2019 had a lower percentage of whole kernels than the samples in 2018.
- Whole kernel averages for Gulf, Pacific Northwest and Southern Rail ECAs were 91.5, 88.9 and 91.7%, respectively.