
Test Weight
 Test weight (weight per volume) is a measure of bulk density and is often used as a general indicator of overall quality and as a gauge of endosperm hardness for alkaline cookers and dry millers. High test weight corn takes up less storage space than the same weight of corn with lower test weight. Genetic differences initially impact the structure of the kernel for test weight. However, it is also affected by moisture content, method of drying, physical damage to the kernel (broken kernels and scuffed surfaces), foreign material in the sample, kernel size, stress during the growing season and microbiological damage. When sampled and measured at the point of delivery from the farm at a given moisture content, high test weight generally indicates high quality, a high percent of horneous (or hard) endosperm and sound, clean corn. Test weight is positively correlated with true density and reflects kernel hardness and good maturation conditions.
Results
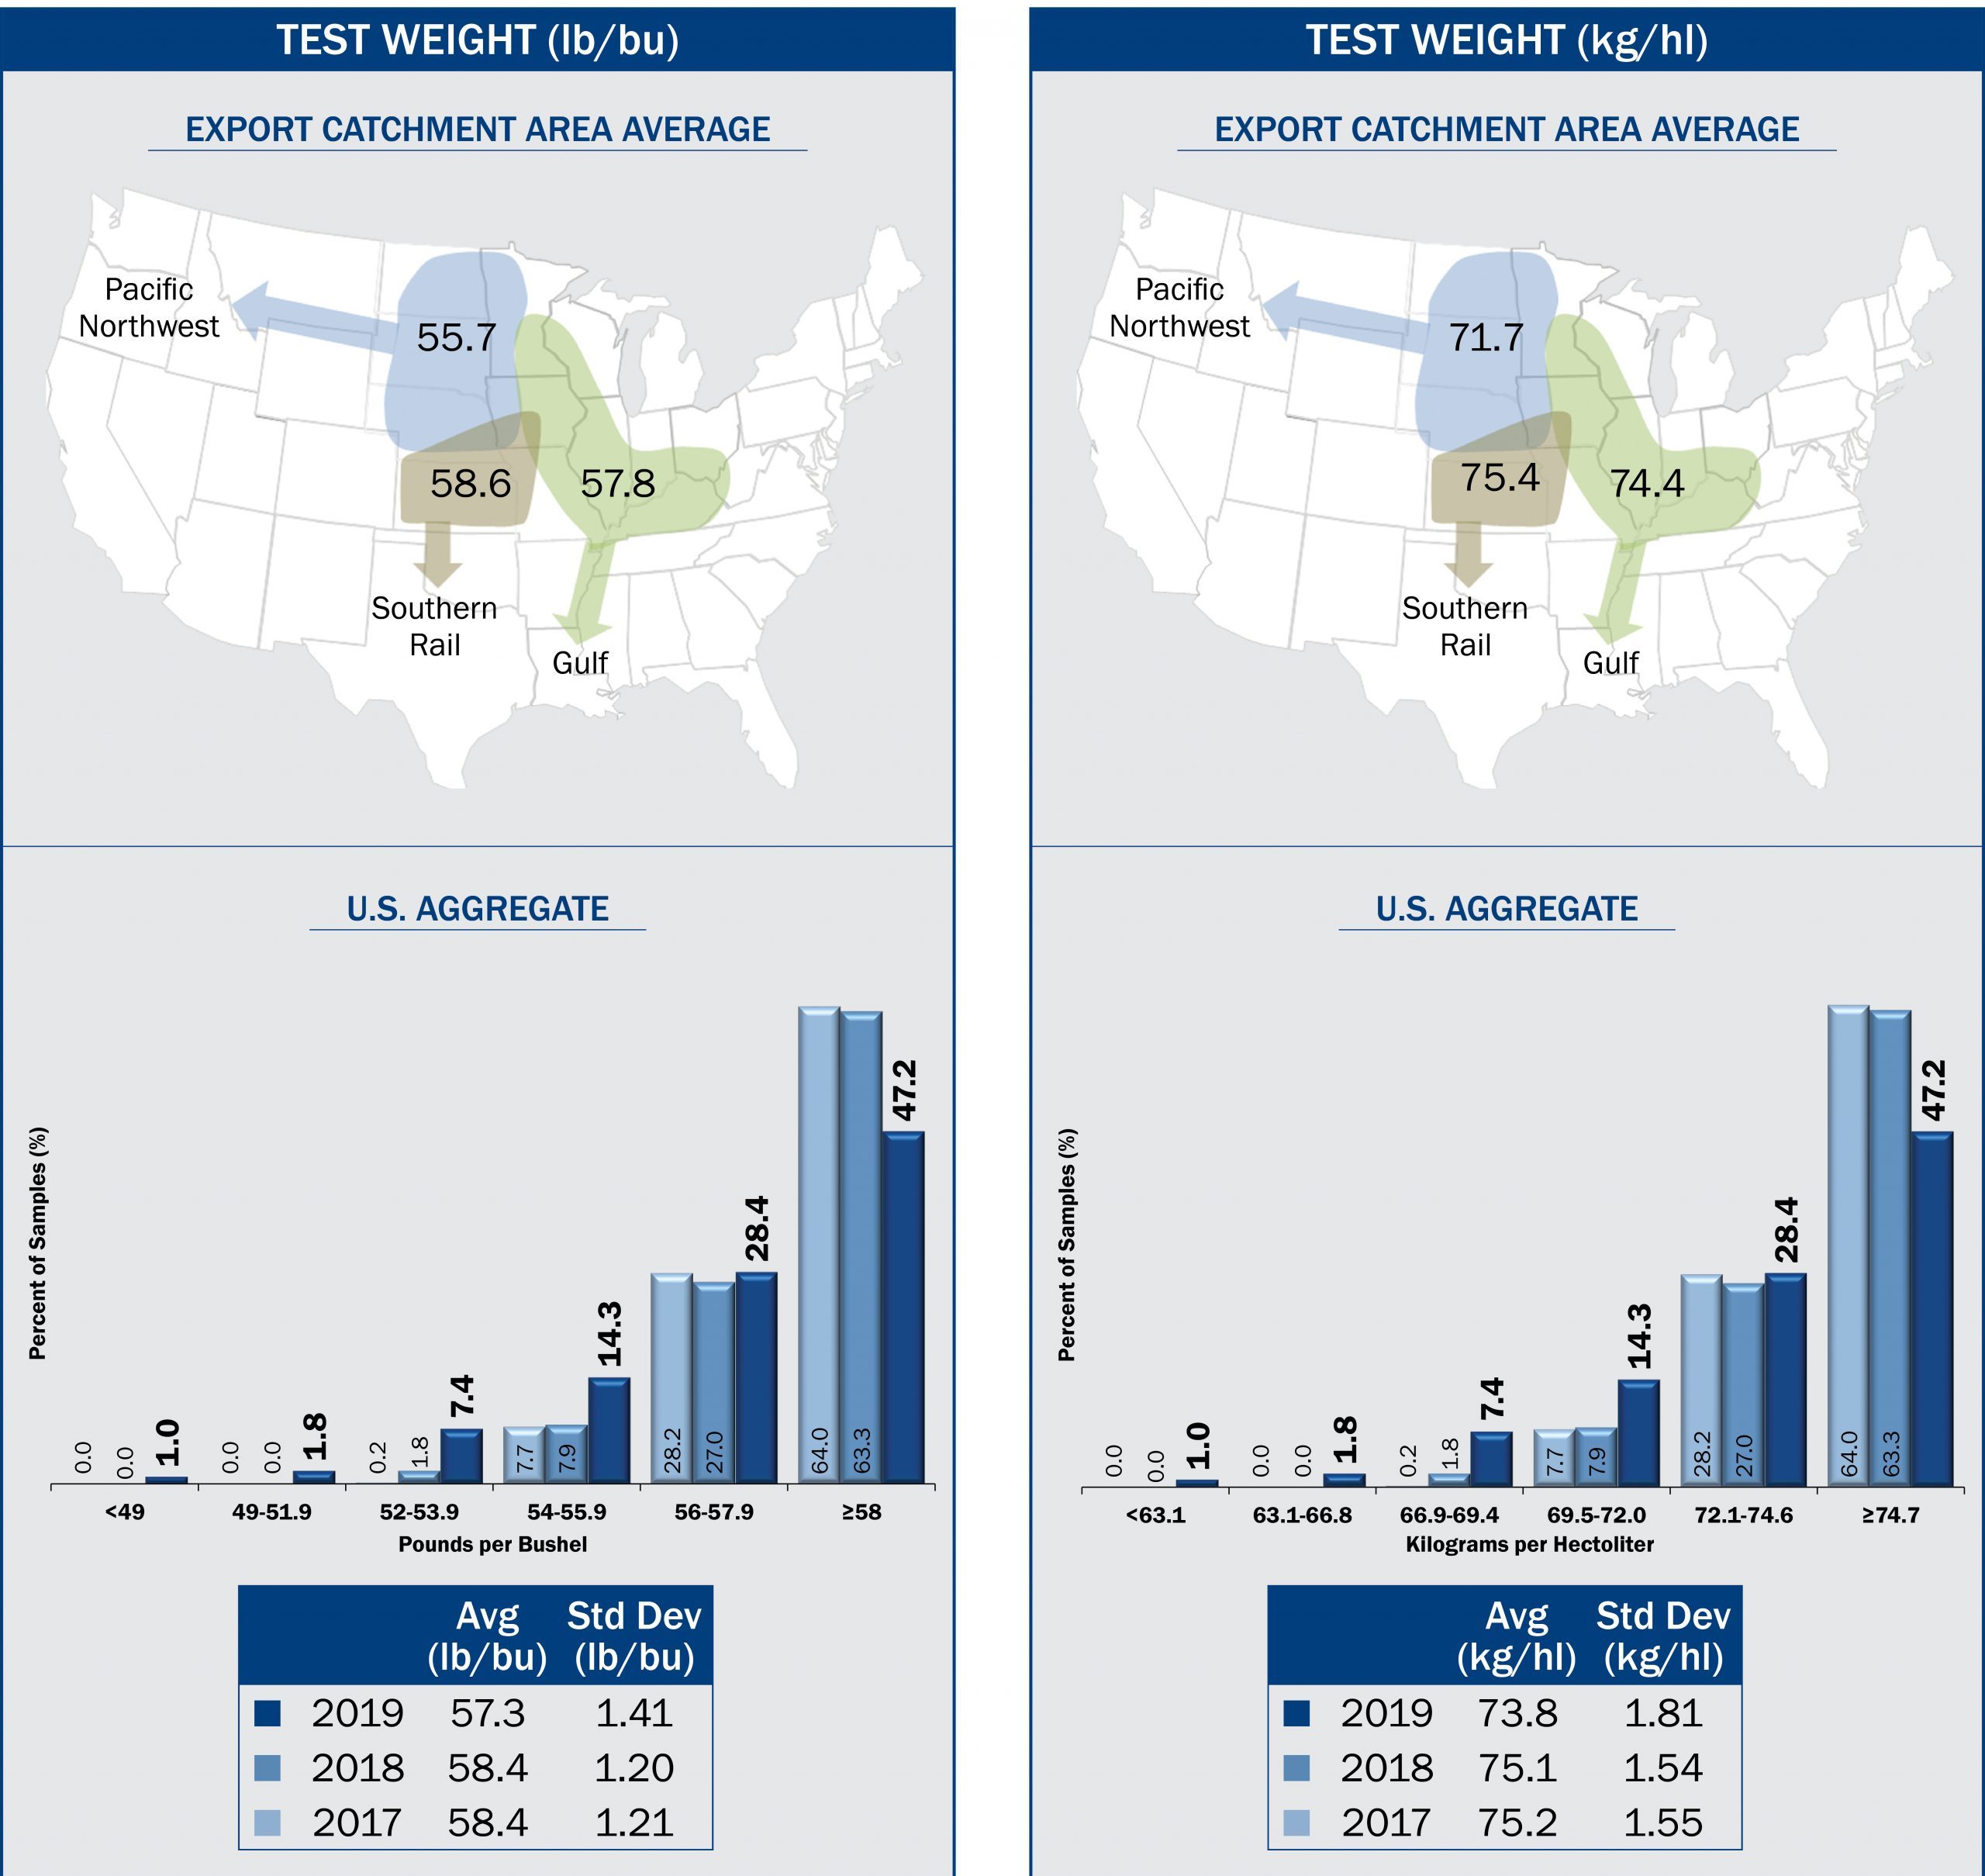
- Average U.S. Aggregate test weight in 2019 (57.3 lb/bu or 73.8 kg/hl) was lower than
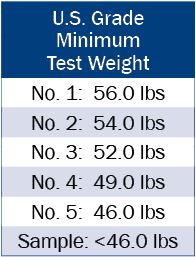
2018 and 2017 (both 58.4 lb/bu or 75.2 kg/hl, and the 5YA (58.2 lb/bu or 74.9 kg/hl), but well above the minimum for U.S. No. 1 grade
(56.0 lb/bu). - U.S. Aggregate test weight standard deviation in 2019 (1.41 lb/bu) was higher than 2018 (1.20 lb/bu), 2017 (1.21 lb/bu) and the 5YA (1.21 lb/bu).
- The range in values among the 2019 harvest samples was 19.3 lb/bu (from 42.6 to
61.9 lb/bu), was greater than the 9.8 lb/bu range in the 2018 samples (from 52.3 to
62.1 lb/bu) and the 10.6 lb/bu range in 2017 (from 52.1 to 62.7 lb/bu). - The 2019 test weight values were distributed with 75.6% of the samples at or above the factor limit for U.S. No. 1 grade (56.0 lb/bu) compared to 90.3% in 2018 and 92.2% in 2017. In 2019, 89.9% of the samples were above the limit for U.S. No. 2 grade (54.0 lb/bu), compared to 98.2% in 2018 and 99.9% in 2017.
- In 2019, the Gulf (57.8 lb/bu) and Southern Rail (58.6 lb/bu) ECAs had the highest average test weights. The Pacific Northwest ECA (55.7 lb/bu) had the lowest test weight in 2019, 2018, 2017 and the 5YA.
- In addition to having the lowest test weight in 2019, the Pacific Northwest ECA also had the highest variability, as indicated by its higher standard deviation (1.80 lb/bu), compared to the Gulf (1.27 lb/bu) and Southern Rail ECAs (1.18 lb/bu).
Broken Corn and Foreign Material (BCFM)
 BCFM is an indicator of the amount of clean, sound corn available for feeding and processing. The lower the percentage of BCFM, the less foreign material or fewer broken kernels are in a sample. Higher levels of BCFM in farm-originated samples generally stem from harvesting practices or weed seeds in the field. BCFM levels will normally increase during drying and handling, depending on the methods used and the soundness of the kernels.
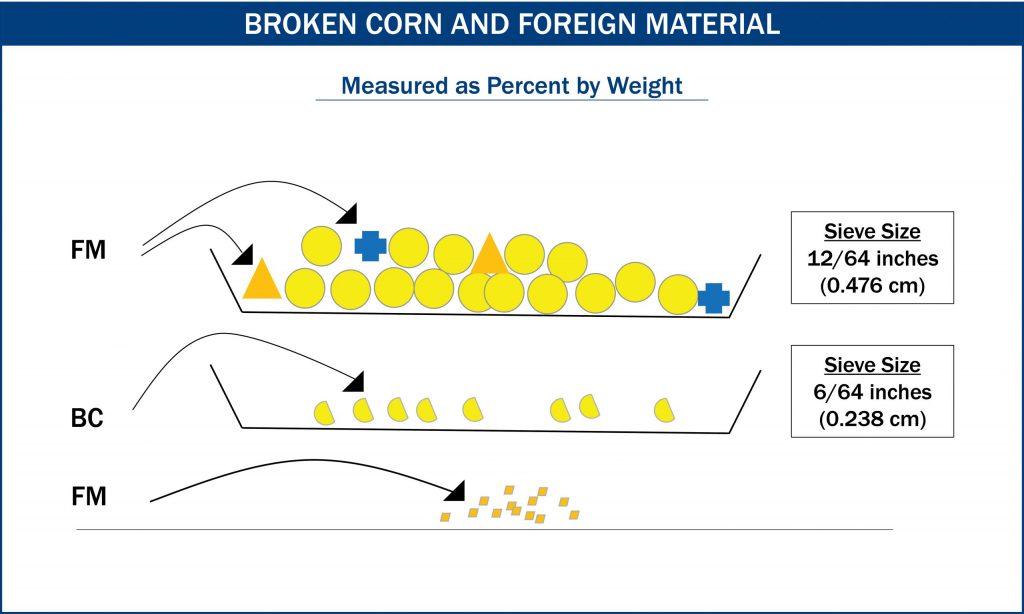
- Broken corn (BC) is corn and any other material (such as weed seeds) small enough to pass through a 12/64th-inch round-hole sieve, and too large to pass through a 6/64th-inch round-hole sieve.Foreign material (FM) is any non-corn material too large to pass through a 12/64th-inch round-hole sieve, as well as all fine material small enough to pass through a 6/64th-inch round-hole sieve. The diagram shown below illustrates the measurement of broken corn and foreign material for the U.S. corn grades.
Results
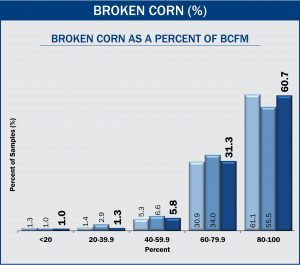
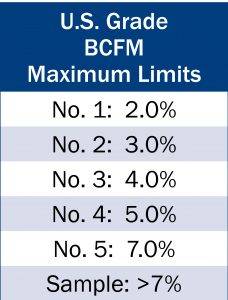
- Average U.S. Aggregate BCFM in 2019 (1.0%) was higher than 2018 (0.7%), 2017 and the 5YA (both 0.8%) but well below the maximum for U.S. No. 1 grade (2.0%).
- The variability of BCFM in the 2019 crop, based on standard deviation (0.67%), was higher than 2018 (0.51%), 2017 (0.57%) and the 5YA (0.53%).
- The range between minimum and maximum BCFM values in 2019 of 0.0 to 8.2% (8.2%) was higher than in 2018 (7.5%) and 2017 (7.3%).
- The 2019 samples were distributed with 92.3% of the samples at or below the maximum BCFM level for U.S. No. 1 grade (2.0%), compared to 95.3% in 2018 and 94.7% in 2017. BCFM levels in nearly all samples (96.8%) were equal to or below the maximum 3.0% limit for No. 2 grade.
- Average BCFM for the Gulf, Pacific Northwest and Southern Rail ECAs (0.9, 1.2 and 0.8%, respectively) were all below the limit for No.1 grade. The difference in average BCFM among ECAs was 0.1 to 0.4% in 2019, compared to only 0.0 to 0.1% in 2018, 2017 and the 5YA.
Total Damage
 Total damage is the percent of kernels and pieces of kernels that are visually damaged in some way, including damage from heat, frost, insects, sprouting, disease, weather, ground, germ and mold. Most of these types of damage result in some discoloration or change in kernel texture. Damage does not include broken pieces of grain that are otherwise normal in appearance.
Mold damage is usually associated with higher moisture content and warm temperatures during the growing season or storage. There are several field molds, such as Diplodia, Aspergillus, Fusarium and Gibberella, that can lead to mold-damaged kernels during the growing season if the weather conditions are conducive to their development. While some fungi that produce mold damage can also produce mycotoxins, not all fungi produce mycotoxins. The chance of mold decreases as corn is dried and cooled to lower temperatures.
Results
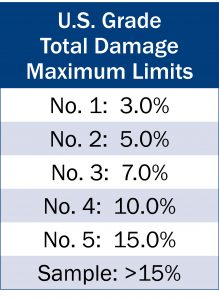
- Average U.S. Aggregate total damage in 2019 (2.7%) was higher than in 2018 (1.5%), 2017 (1.3%) and the 5YA (1.7%). The 2019 total damage average was below the limit for U.S. No. 1 grade (3.0%).

- Total damage variability in the 2019 crop, as measured by the standard deviation (2.43%), was much higher than 2018 (1.25%), 2017 (1.09%) and the 5YA (1.26%).
- The range for total damage in 2019 (0.0 to 50.5%) was much greater than 2018 (0.0 to 19.3%) and 2017 (0.0 to 13.6%). The exceptionally wide range and high variability in total damage was likely due to late maturation, slow drying and prolonged harvest conditions for the 2019 crop.
- Total damage in the 2019 samples was higher than in previous years, with 73.5% of the samples having 3.0% or less and 91.5% having 5.0% or less damaged kernels, compared to 2018 with 89.2% and 97.1%, and 2017 with 90.3% and 97.3%, respectively.
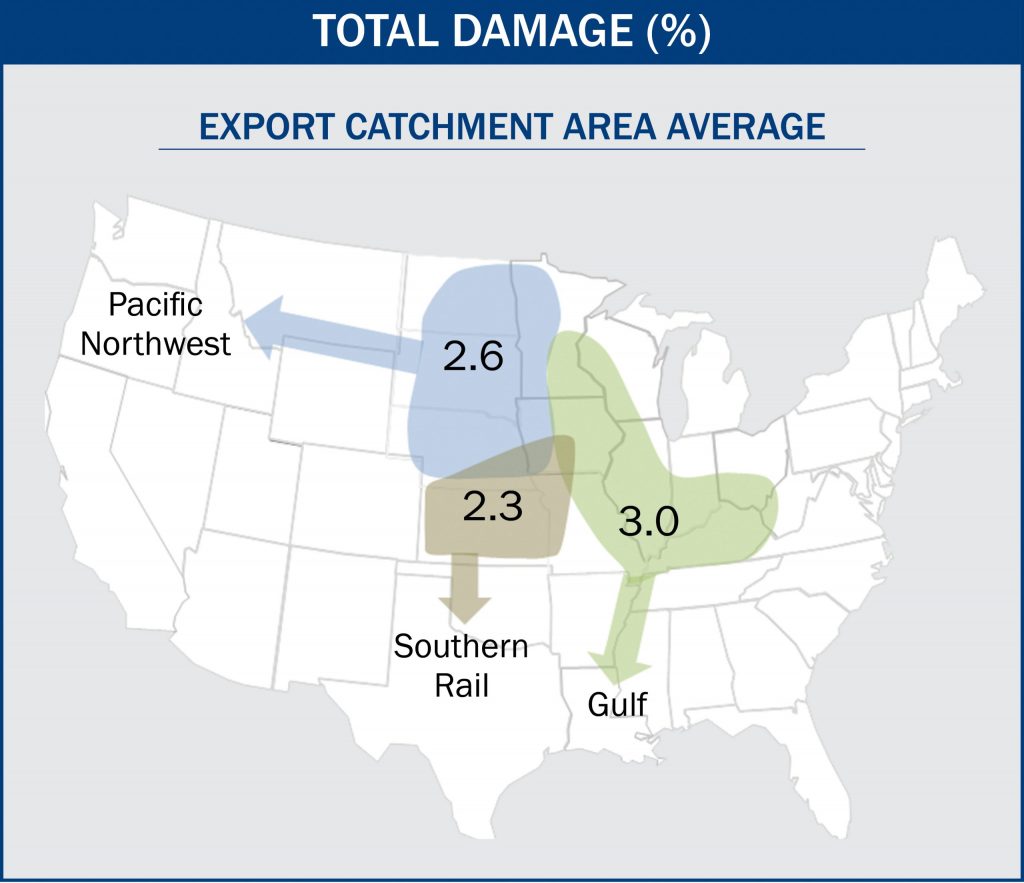
- The average total damage by ECA was 3.0% for Gulf, 2.6% for Pacific Northwest and 2.3% for Southern Rail. The Gulf ECA had the highest or tied for the highest total damage for 2019, 2018, 2017 and the 5YA.
- The average total damage values in all ECAs were at or below the limit for U.S. No. 1 grade (3.0%).
Heat Damage
 Heat damage is a subset of total damage and has separate allowances in the U.S. Grade standards. Heat damage can be caused by microbiological activity in warm, moist grain or by high heat applied during drying. Heat damage is seldom present in corn delivered directly from farms at harvest.
Results
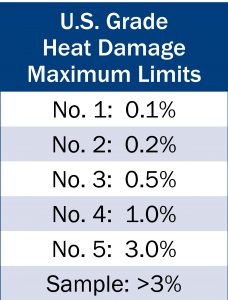
- No heat damage was reported in any of the 2019 samples, the same results as 2018, 2017 and the 5YA.
- The absence of heat damage likely was due, in part, to fresh samples coming directly from farm to elevator with minimal artificial drying.