
Kernel Volume
Kernel volume, measured in cubic centimeters (cm3), is often indicative of growing conditions. If conditions are dry, kernels may be smaller than average. If a drought hits later in the season, kernels may have lower fill. Small or round kernels are more difficult to degerm. Additionally, small kernels may lead to increased cleanout losses for processors and higher yields of fiber.
Results
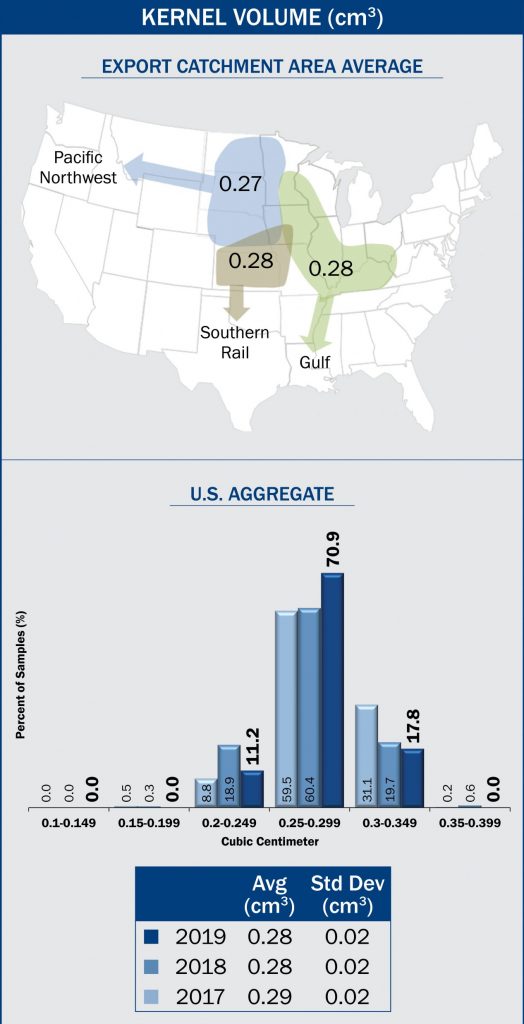 U.S. Aggregate kernel volume averaged 0.28 cm3 in 2019, same as 2018 and 5YA, but lower than 2017 (0.29 cm3).
- Kernel volume variability was constant across the years. The standard deviation for U.S. Aggregate kernel volume was 0.02 cm3 for 2019, 2018, 2017 and the 5YA.
- Kernel volume range in 2019 (0.22 to 0.34 cm3) was similar to 2018 (0.19 to 0.36 cm3) and 2017 (0.18 to 0.36 cm3).
- The kernel volumes in 2019 were distributed, with 17.8% of the samples having kernel volumes of 0.30 cm3 or greater, compared to 2018 (20.3%) and 2017 (31.3%). This distribution indicates there was a lower percentage of large kernels in 2019 compared to 2018 and 2017.
- Kernel volume for the Gulf, Pacific Northwest and Southern Rail ECAs averaged 0.28, 0.27 and 0.28 cm3, respectively. Among the ECAs, the Pacific Northwest ECA had the lowest average kernel volume in 2019, 2018, 2017 and the 5YA.