B. Moisture
Moisture content is reported on official grade certificates, but does not determine which numerical grade will be assigned to the sample. Moisture content affects the amount of dry matter being sold and purchased. Moisture is also an indicator for potential drying, has potential implications for storability, and affects test weight. Higher moisture content at harvest increases the chance of kernel damage occurring during harvesting and drying. Moisture content and the amount of drying required will also affect stress cracks, breakage, and germination. Extremely wet grain may be a precursor to high mold damage later in storage or transport. While the weather during the growing season affects yield and the development of the grain, grain harvest moisture is influenced largely by the timing of harvest and harvest weather conditions.
RESULTS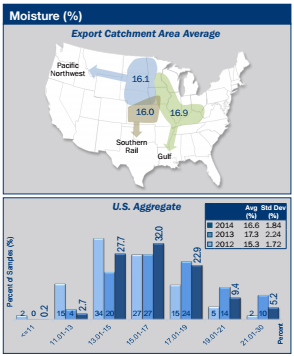
- The U.S. Aggregate moisture recorded at the elevator in the 2014 samples averaged 16.6%, significantly lower than 2013 (17.3%), but higher than 2012 (15.3%) and 3YA (16.0%).
- The moisture content of the 2014 samples at harvest was less variable than the 2013 crop, as indicated by the lower standard deviation (1.84% in 2014 compared to 2.24% in 2013), but very close to 3YA of 1.84%.
- The range was greater among the 2014 samples than among the 2013 samples – 10.9 to 29.9% in 2014 compared to 10.9 to 28.2% in 2013.
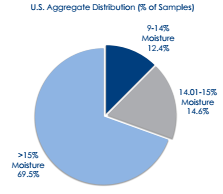
- The 2014 moisture values were distributed with 30.6% of the samples containing 15% or less moisture. This is the base moisture used by most elevators for discounts and is a level considered safe for storage for short periods during low winter-time temperatures.
- In the 2014 crop, 12.4% contained 14% or less moisture compared to 10.0% in 2013 and 31.7% in 2012. Moisture of 14% is generally considered a safe level for longer–term storage and transport.
- The distribution of moisture levels in the 2014 crop indicates 37.5% of the samples were above 17%, compared to 48% in 2013 and only 22% in 2012. Both the 2014 and 2013 crops had a requirement for more drying than in 2012.
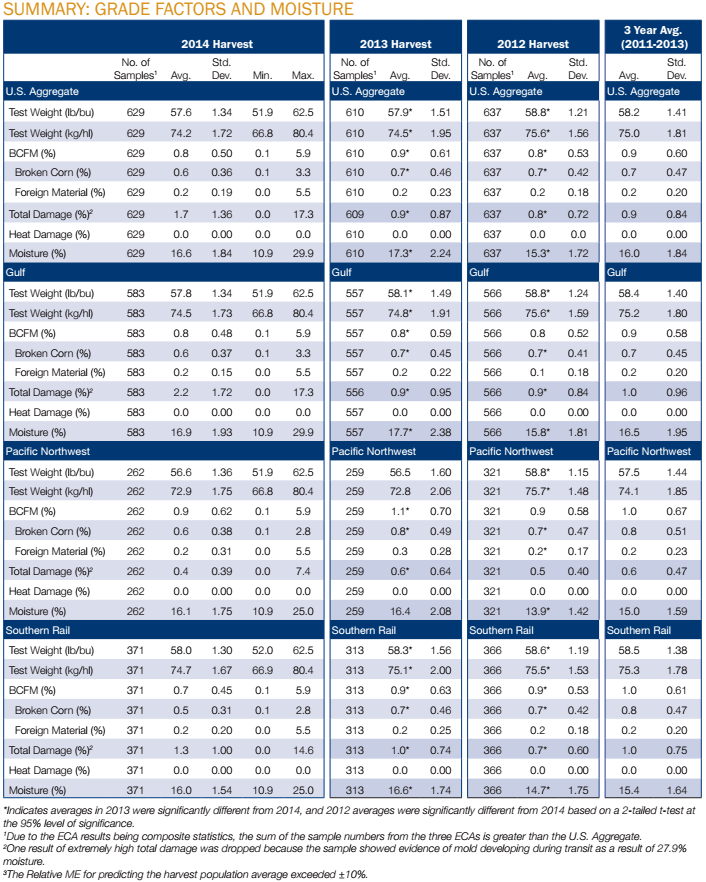
- The average moisture contents for corn from the Gulf, Pacific Northwest, and Southern Rail ECAs were 16.9%, 16.1% and 16.0%, respectively. The Gulf ECA average moisture content has been consistently higher than the other ECAs in the previous two years and for 3YA, likely due to weather conditions providing lower drying potential for the Gulf ECA than for other ECAs.