
V. U.S. CORN PRODUCTION, USAGE AND OUTLOOK
A. U.S. Corn Production1
1. U.S. Average Production and Yields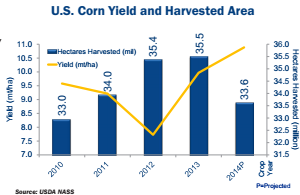
- According to the November 2014 USDA World Agricultural Supply and Demand Estimates (WASDE) report, average U.S. corn yield for the 2014 crop is projected to be 10.9 mt/ ha (173.4 bu/ac). This is 0.9 mt/ha (14.6 bu/ac) higher than the 2013 corn crop and the highest average yield on record.
- The number of hectares harvested in 2014 is projected to be 33.6 million (83.1 mil ac). This is 1.9 mil ha (4.6 mil ac) less than in 2013, which was the largest number of harvested hectares over the last 80 years. The projected 33.6 mil ha harvested in 2014 ranks sixth over the last 80 years and fifth-highest in the past 10 years.
- Total U.S. corn production for 2014 is projected to be 366.0 mmt (14,407 mil bu). This is about 12.3 mmt (482 mil bu) higher than 2013 and the largest U.S. corn crop on record.
- While 2014 saw slightly lower harvested hectares than in 2013, significantly higher yields in key U.S. cornproducing areas in 2014 resulted in projected record total production.
1mt – metric ton; mmt – million metric tons; ha – hectare; bu – bushel; mil bu – million bushels; ac – acre
2. ASD and State-Level Production
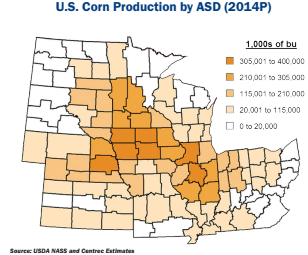
The geographic areas included in the Harvest Report encompass the highest corn-producing areas in the United States. This can be seen on the map showing projected 2014 corn production by USDA Agricultural Statistical District (ASD).
The record size of the 2014 corn crop was primarily driven by significantly higher production in Illinois, Iowa and Missouri compared to 2013. Of the remaining nine states, Indiana, Kansas, South Dakota and Wisconsin had slightly higher production, while Minnesota had about the same level of production, and Kentucky, Nebraska, North Dakota and Ohio had slightly lower production.
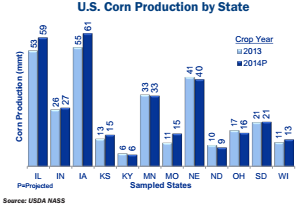
The U.S. Corn Production table summarizes the differences in both quantity (mmt) and percentages between 2013 and projected 2014 corn production for each state. Also included is an indication of the relative changes in harvested acres and yield between 2013 and projected 2014. The green bar indicates a relative increase and the red bar indicates a relative decrease from 2013 to projected 2014. This illustrates that harvested acres were largely unchanged to slightly lower, with the exception of North Dakota, which experienced a 24% reduction in harvested acres. Yield changes were largely unchanged to slightly higher, with the exception of significantly higher yields in Kansas and Missouri and slightly lower yields in Kentucky.
