II. INTRODUCTION
The U.S. Grains Council Corn Harvest Quality Report 2014/15 has been designed to help international buyers of U.S. corn understand the initial quality of U.S. yellow commodity corn as it enters the merchandising channel. This is the fourth annual measurement survey of the quality of the U.S. corn crop at harvest. With four years of results, patterns in the impact of weather and growing conditions on the quality of the U.S. corn as it comes out of the field are surfacing.
Similar to the 2013 crop year, 2014 started with a cool and wet planting season. The summer of 2014 was cooler than average, slowing maturation a week behind average but not as delayed as in 2013. Harvest at the beginning of both 2014 and 2013 was delayed by multiple weeks of rain and cold temperatures. The 2012 crop year was defined by its early planting season and a severe drought prompting early plant maturity and harvest. These differences in the growing season conditions contributed to the quality differences of the corn crop years as they reached the first stage in the merchandising channel. In 2014, higher yields resulted in lower protein and accompanying high starch concentration compared to the previous years. The late start to the growing season and harvest conditions in 2014 contributed to higher average moisture contents than in 2012, higher total damage, and stress cracks similar to but slightly lower than 2013. True density, horneous endosperm and test weight were all lower than the average of the Harvest Reports 2011/12, 2012/13 and 2013/14 (referred to as 3YA), indicating a softer corn. BCFM remained low in 2014.
These observations show quality differences among the three years, but overall, the Harvest Quality Report 2014/15 indicates good quality corn entering the 2014/15 market channel. 59% of the samples meet all requirements for No. 1 grade and 88% meet No. 2 grade or better. While the maximum values in moisture and total damage suggest judicious management for storage, average values show a crop that will store and handle well as it moves through the market channel to export.
Four years of data are laying the foundation for evaluating trends and the factors that impact corn quality. In addition, the cumulative Harvest Report measurement surveys are increasing in value by enabling export buyers to make yearto-year comparisons and assess patterns of corn quality based on crop growing conditions across the years.
This Harvest Report 2014/15 is based on 629 yellow commodity corn samples taken from defined areas within 12 of the top corn-producing and exporting states. Inbound samples were collected from local grain elevators to observe quality at the point of origin and to provide representative information about the variability of the quality characteristics across the diverse geographic regions.
The sampling areas in the 12 states are divided into three general groupings that are labeled Export Catchment Areas (ECAs). These three ECAs are identified by the three major pathways to export markets: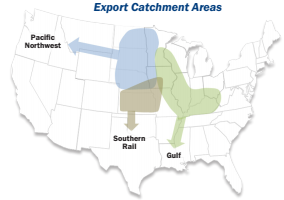
- The Gulf ECA consists of areas that typically export corn through U.S. Gulf ports;
- The Pacific Northwest (PNW) ECA includes areas exporting corn through Pacific Northwest and California ports; and
- The Southern Rail ECA comprises areas generally exporting corn to Mexico.
Sample test results are reported at the U.S. Aggregate level and for each of the three ECAs, providing a general perspective on the geographic variability of U.S. corn quality.
The quality characteristics of the corn identified at harvest establish the foundation for the quality of the grain ultimately arriving at the export customers’ doors. However, as corn passes through the U.S. marketing system, it is mingled with corn from other locations, aggregated into trucks, barges and rail cars, stored, and loaded and unloaded several times. Therefore, the quality and condition of the corn change from the initial market entry to the export elevator. For this reason, the Harvest Report 2014/15 should be considered carefully in tandem with the U.S. Grains Council Corn Export Cargo Quality Report 2014/15 that will follow early in 2015. As always, the quality of an export cargo of corn is established by the contract between buyer and seller, and buyers are free to negotiate any quality factor that is important to them.
This report provides detailed information on each of the quality factors tested, including averages and standard deviations for the aggregate of all samples, and for each of the three ECAs. The “Quality Test Results” section summarizes the following quality factors:
- Grade Factors: test weight, broken corn and foreign material (BCFM), total damage, and heat damage
- Moisture
- Chemical Composition: protein, starch, and oil
- Physical Factors: stress cracks/stress crack index, 100-kernel weight, kernel volume, kernel true density, whole kernels, and horneous (hard) endosperm
- Mycotoxins: aflatoxin and DON
In addition, this Harvest Report includes brief descriptions of the U.S. crop and weather conditions; U.S. corn production, usage and outlook; and detailed descriptions of survey and statistical analysis methods, and testing methods.
New to this Harvest Report 2014/15 is a simple average of the quality factors’ averages and standard deviations of the previous three Harvest Reports (2011/12, 2012/13 and 2013/14). These simple averages are calculated for the U.S. Aggregate and each of the three ECAs and are referred to as “3YA” in the report.