
Statistical Analysis
The sample test results for the grade factors, moisture content, chemical composition and physical factors were summarized for the U.S. Aggregate and also by the three ECAs (Gulf, Pacific Northwest and Southern Rail) and the following two contract grade categories:
- “U.S. No. 2” or “U.S. No. 2 or better” contracts specify that the corn must at least meet U.S. No. 2 factor limits or be better than U.S. No. 2 factor limits.
- “U.S. No. 3” or “U.S. No. 3 or better” contracts specify that the corn must at least meet U.S. No. 3 factor limits or be better than U.S. No. 3 factor limits.
Within this 2018/2019 Export Cargo Report is a simple average of the quality factors’ averages and standard deviations of the previous five Export Cargo Reports (2013/2014, 2014/2015, 2015/2016, 2016/2017 and 2017/2018). These simple averages are calculated for the U.S. Aggregate and each of the three ECAs and are referred to as the “5YA” in the text and summary tables of the report.
The Relative ME was calculated for each of the quality factors tested for this study at the U.S. Aggregate level and for each of the ECAs. The Relative ME was not more than ±10% for all the quality attributes at the U.S. Aggregate level. The table shown below displays all Relative MEs exceeding ±10.0% by quality factor and composite grouping.
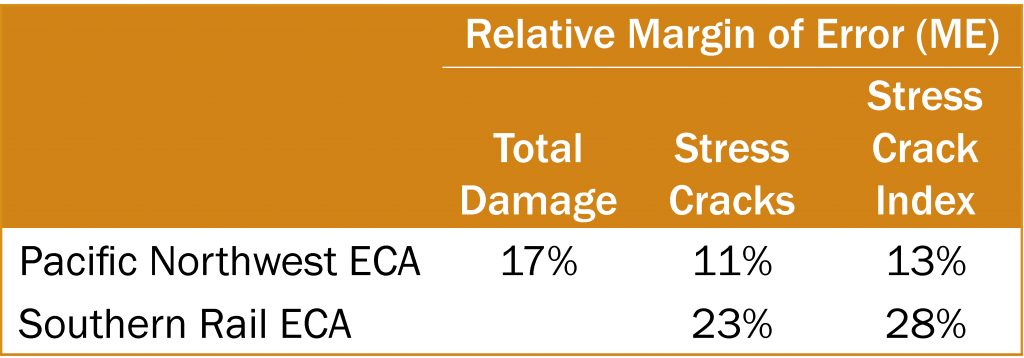
While the level of precision for these quality factors in the three ECAs is less than desired, the levels of Relative ME do not invalidate the estimates. The averages for the quality factors are the best possible unbiased estimates of the true population means. However, they are estimated with greater uncertainty than the quality factors with a Relative ME of less than ±10%. Footnotes in the summary tables for “Grade Factors and Moisture” and “Physical Factors” indicate the attributes for which the Relative ME exceeds ±10%. This allows the reader to keep in mind the greater degree of uncertainty of the sample average representing the true population mean.
References in the “Quality Test Results” section to statistical differences were validated by 2-tailed t-tests at the 95% confidence level. These tests were calculated to determine statistical differences between quality factor averages from this Export Cargo Report and the following:
- This year’s Harvest Report and
- Each of the previous two Export Cargo Reports.
In addition, tests were conducted to determine statistical differences between the quality factor averages from shipments loaded as contract grade U.S. No. 2 or better and those loaded as contract grade U.S. No. 3 or better in this year’s Export Cargo Report.