Overview
The key points for the survey design and sampling and statistical analysis for this 2018/2019 Export Cargo Report are as follows:
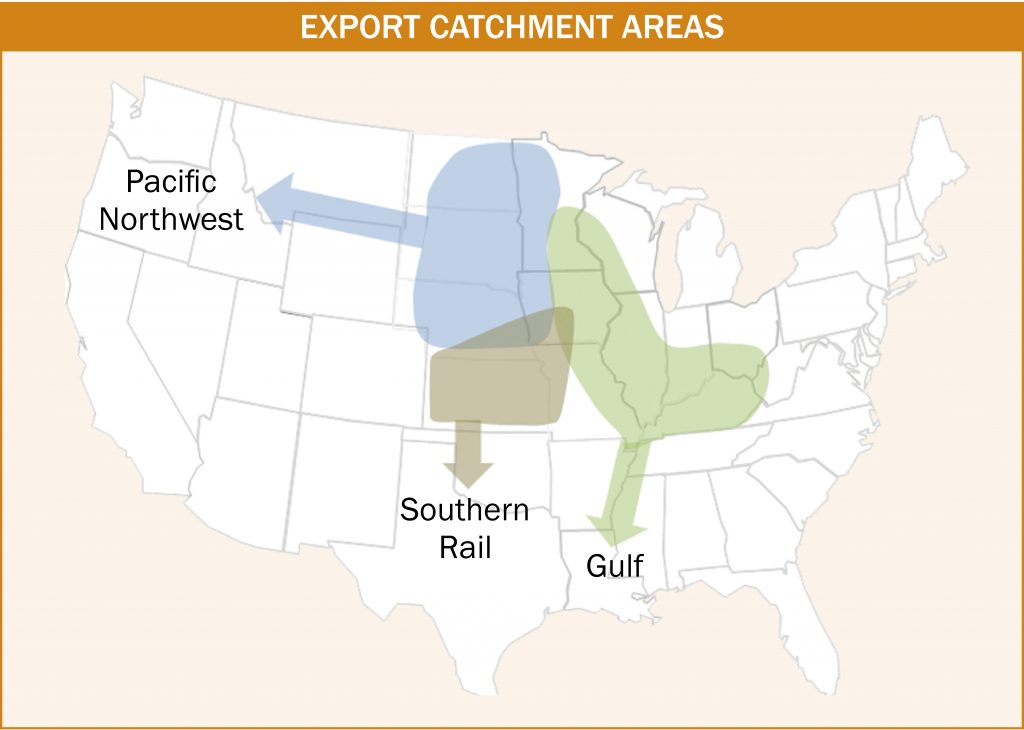
- Following the methodology developed for the previous seven Export Cargo Reports, samples were proportionately stratified according to ECAs – the Gulf, Pacific Northwest and Southern Rail.
- To achieve no more than a ±10% Relative ME for the U.S. Aggregate level and to ensure proportionate sampling from each ECA, the targeted number of total samples was 431 samples, to be collected from the ECAs as follows: 270 from the Gulf, 96 from the Pacific Northwest and 65 from the Southern Rail.
- A total of 436 samples were ultimately tested for this survey as 275 samples from the Gulf were received. Since additional samples from the Gulf were included in the survey, the weight of each Gulf sample was adjusted so that the Gulf’s overall weight in the survey remained unchanged relative to the other two ECAs.
- Weighted averages and standard deviations following standard statistical techniques for proportionate stratified sampling were calculated for the U.S. Aggregate and the three ECAs.
- Southern Rail ECA samples were provided by official agencies designated by the FGIS that inspect and grade rail shipments of corn destined for export to Mexico. Gulf and Pacific Northwest samples were collected by FGIS field offices at ports in the respective ECAs.
- To evaluate the statistical validity of the results, the Relative ME was calculated for each quality attribute at the U.S. Aggregate and the three ECA levels. The Relative ME for each of the quality factor results was not more than ±10% at the U.S. Aggregate level. The Relative ME exceeded ±10% for total damage, stress cracks and stress crack index in the Pacific Northwest ECA; and stress cracks and stress crack index in the Southern Rail ECA (see table on page 59).
- Two-tailed t-tests at the 95% confidence level were calculated to measure statistical differences between the 2018/2019 and 2017/2019 and the 2018/2019 and 2016/2017 quality factor averages.