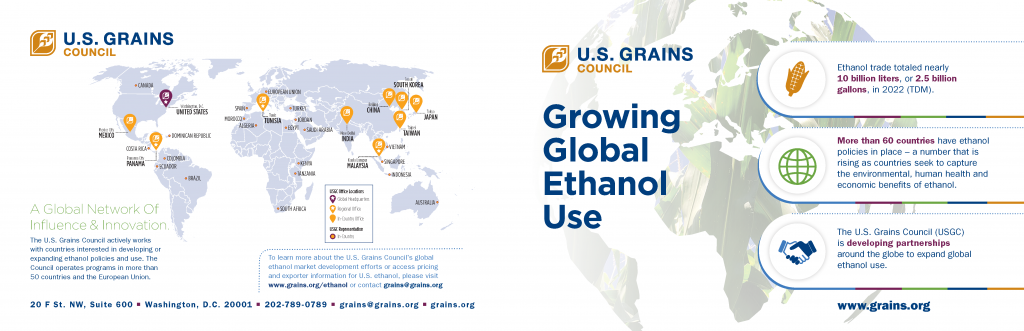
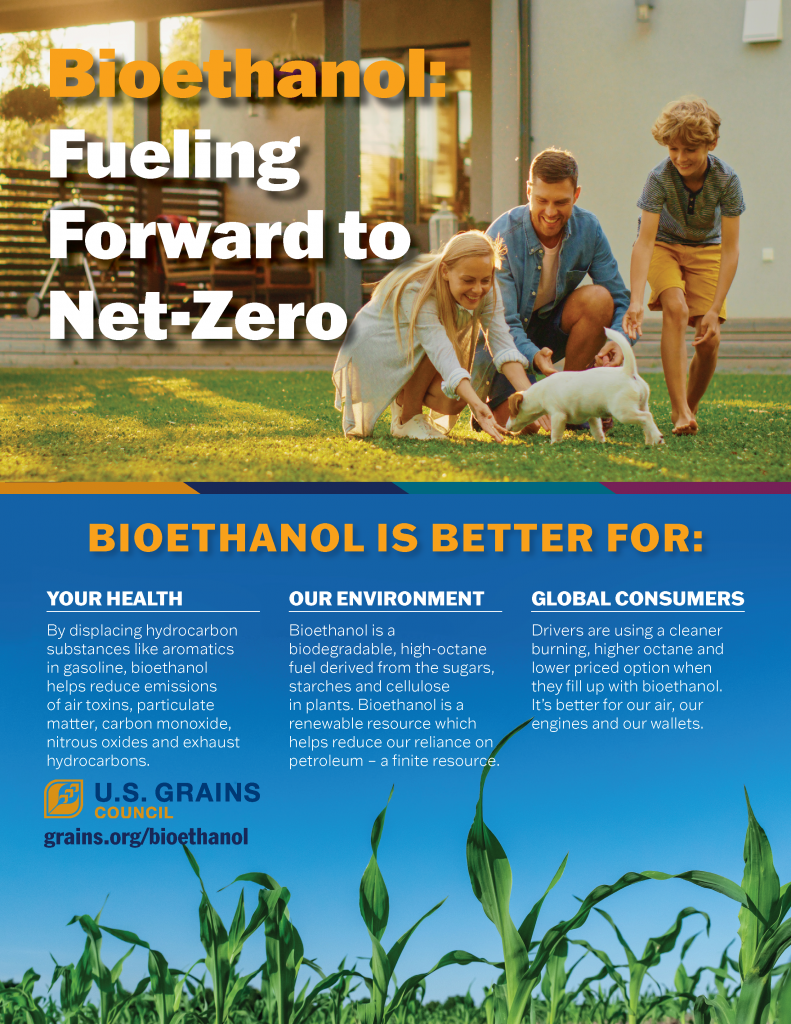
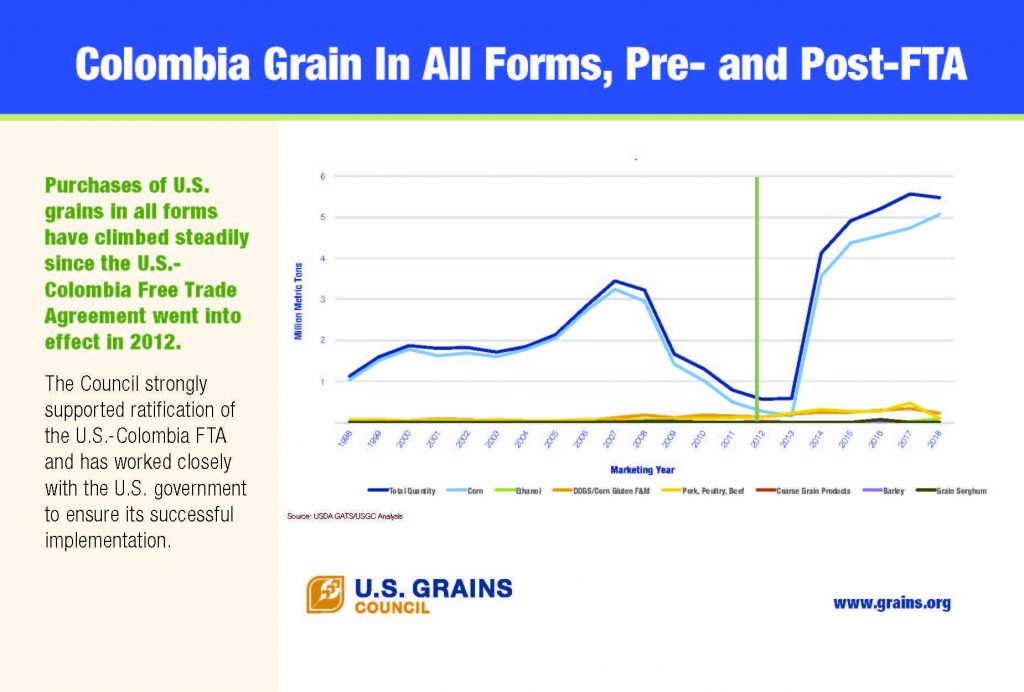
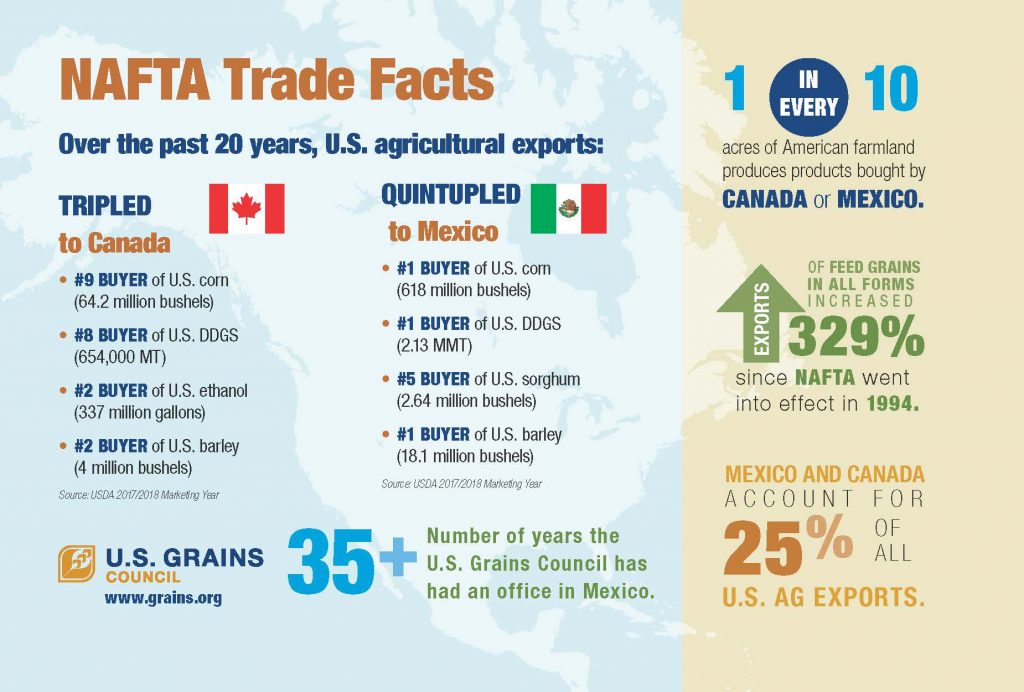
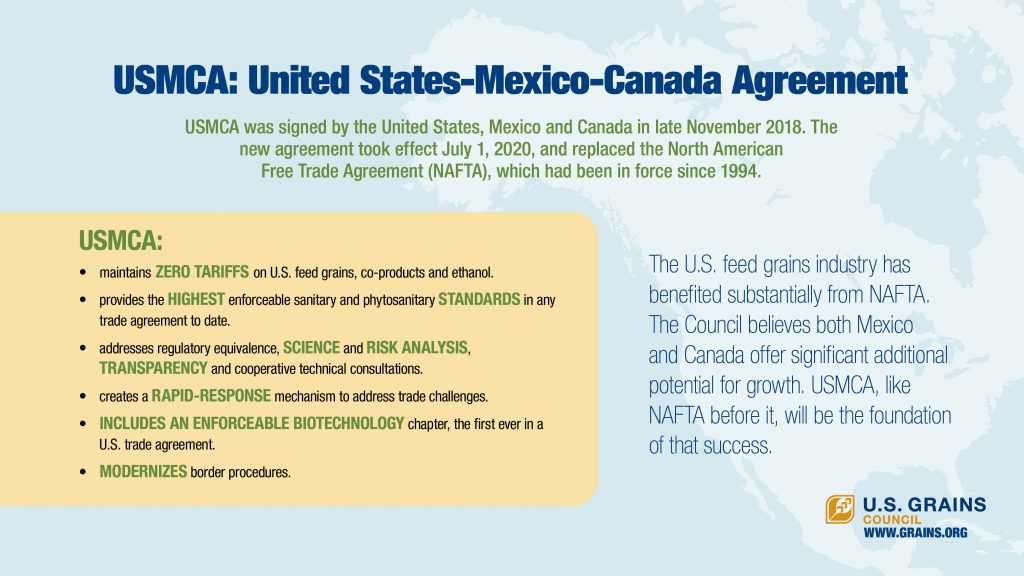
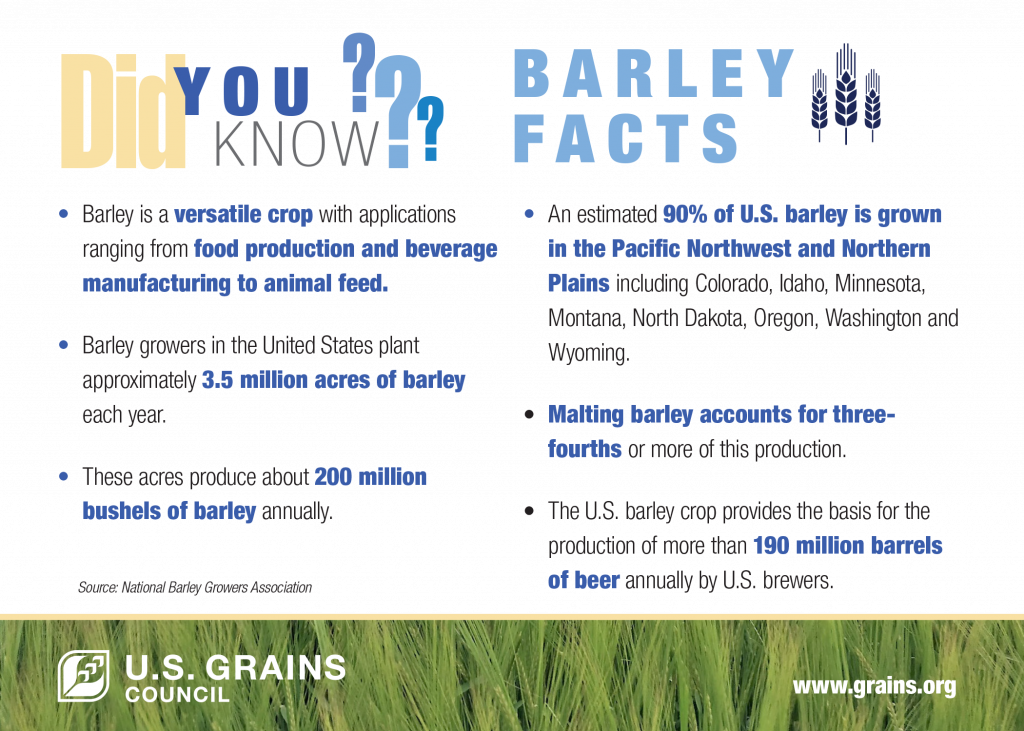
Home / News & Events / Multimedia Resources / InfographicsInfographics U.S. Bioethanol Advantage Vehicle Compatibility With Ethanol Ethanol’s Octane Advantage Global Bioethanol Effective Blend Rates Global Bioethanol Blending Policies Map U.S. Corn Role In Mexico Trade USGC Budget Breakdown Where Is U.S. Corn Going MY 23/24 Where Is U.S. Barley Going MY 23/24 Where Are U.S. Grains In All Forms Going MY 23/24 Where is U.S. Sorghum Going MY 23/24 Where is U.S. DDGS Going MY 23/24 Where is U.S. Ethanol Going MY 23/24 2024 Agricultural Cooperators Conference Results Sustainable Aviation Fuel Four Pillars of Ethanol Ethanol Success Story 2024 Corn Success Story 2024 Buyers and Sellers Conference 2024 Barley Success Story 2024 Sorghum Success Story 2024 Everyday Uses – Corn Everyday Uses – Sorghum Everyday Uses – Barley Growing Seasons USGC Office Map Member Support Anticipated U.S. Ethanol Opportunities in Emerging Global ETJ SAF Markets USGC’s Global Ethanol Presence Understanding Global Carbon Reduction Opportunities for U.S. Fuel Ethanol Producers MY 22/23 Ethanol Exports Growing Global Ethanol Use Ethanol: Fueling Forward to Net-Zero USGC Global Corn Promotion The Benefits of U.S. Grains Exports – English U.S. Corn in the Industrial Starch Sector Booklet USGC Global Barley Promotion Biotechnology U.S. Corn Sustainability USGC Global Sorghum Promotion The Benefits of U.S. Grain Exports – Spanish CSAP U.S. Corn Sustainability Booklet Asia A-Team – Countries of Focus Western Hemisphere A-Team – Countries of Focus MEASA A-Team – Countries of Focus Southeast Asia Successes MAP Funds Have Eroded Success Story: Leading Efforts to Modernize Colombian Feed Industry Success Story: Promotion Efforts Lead to Chinese Demand for U.S. Sorghum Success Story: DDGS Demand in Indonesia Success Story – Key Activities in the Region Success Story: UK Implements E10 Standard Impacts From ATP Economic Impact Export Impact Market Development Investment Comparing Market Development Programs ATP Helps Build Long-Term Grain Markets Promoting Ethanol Around the World U.S. Ethanol Exports Remain Strong How Does U.S. Grain Move? World Fuel Ethanol Production in Million Gallons World Fuel Ethanol Production in Million Liters How We Build Global Grain Demand USGC Resources The Benefits of U.S. Grain Exports USDA Corn Quality Grades Sorghum & Barley: Nutritious Whole Grains Stages of Ethanol Production U.S. Grain: Methods to Ensure Quality USGC’s Expanding Footprint in Africa Common Grain Vessel Sizes U.S. Grain Grading & Inspection Getting U.S. Ethanol and Co-Products to the World Balancing Animal Diets Colombia Grains In All Forms, Pre- and Post-FTA NAFTA Trade Facts USMCA: United States-Mexico-Canada Agreement Barley Export Types Barley Facts The World Is Your Market


