B. Moisture
Moisture content is reported on all official grade certificates, but does not determine which numerical grade will be assigned to the sample. Moisture content is usually specified in the contract by the buyer, independent of the grade. Moisture content is important because it affects the amount of dry matter being sold and purchased. In addition, the average moisture level and variability in a shipment of corn affect its quality upon arrival at its destination. The general guidelines for good quality, clean corn are as follows: a recommended 14% maximum moisture level under aerated storage in U.S. corn-belt conditions for storage up to six to twelve months; and a recommended 13% or less moisture for storage of more than one year.
Corn is typically transported in railcars or in closed, nearly airtight holds during the ocean voyage. Few bulk carriers or railcars have the ability to aerate the grain mass during transit. This lack of aeration can create an ideal environment for pockets of high moisture to initiate microbiological activity. In addition, temperature variations in the grain mass can cause moisture migration, resulting in warm, moist air condensing on colder surfaces of grain, near sidewalls, or on the underside of hatch covers, which can lead to development of spoilage or hot spots. Hot spots are small pockets of grain where the moisture content and temperature become abnormally higher than the average for the cargo. Thus, uniformity of moisture content among sublots and average moisture values of 14% or below are important for minimizing the risk of hot spots developing during transit.
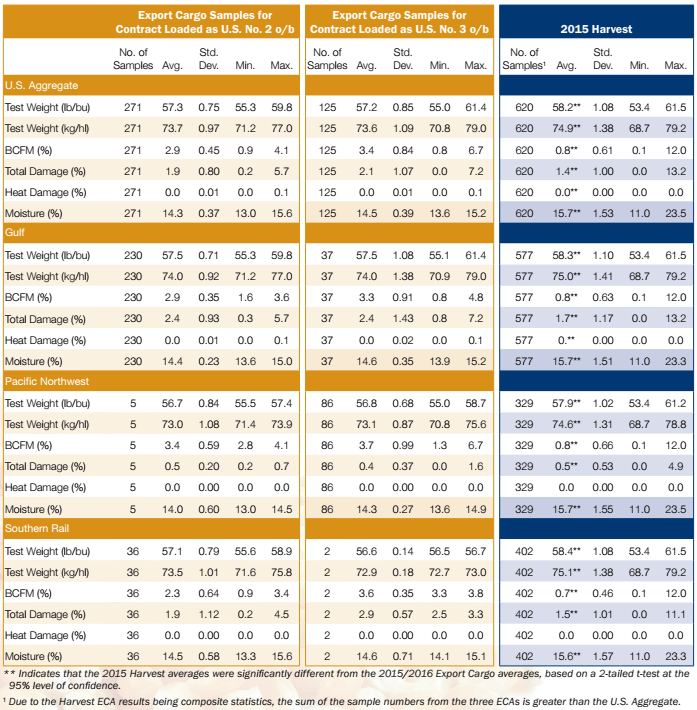
RESULTS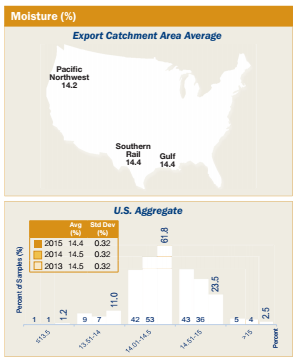
- Average U.S. Aggregate moisture content (14.4%) was similar to 2014/2015 and 2013/2014 (both 14.5%), and same as 4YA (14.4%).
- Moisture content variability among samples for 2015/2016 (standard deviation of 0.32%) was the same as the previous two years (0.32%), and similar to 4YA (0.34%).
- Only 26.0% of the samples had moisture content above 14.5%, compared to 40% in 2014/2015 and 48% in 2013/2014.
- Average moisture content decreased between harvest and export (from 15.7% to 14.4%) and uniformity among samples increased, as indicated by the lower standard deviations at export (0.32%) compared to harvest (1.53%). This increase in uniformity among samples may have resulted from conditioning and commingling in the market channel following harvest.
- The Pacific Northwest ECA’s average moisture (14.2%) was lower than the Gulf and Southern Rail ECAs average moisture (both 14.4%). The Pacific Northwest ECA at export had the lowest moisture among ECAs for each of last two years and for 4YA.
- Moisture content is not a grade-determining factor. However, average moisture was slightly lower for contracts loaded as U.S. No. 2 o/b (14.3%) than for contracts loaded as U.S. No. 3 o/b (14.5%). The moisture range for U.S. No 2 o/b (13.0 to 15.6%) was wider than the range for U.S. No 3 o/b (13.6 to 15.2%); however, the moisture standard deviations for U.S. No. 2 o/b (0.37%) and U.S. No. 3 o/b (0.39%) were similar.