
C. Statistical Analysis
The sample test results for the grade factors, moisture, chemical composition, and physical factors were summarized as the U.S. Aggregate and also by the three ECAs (Gulf, Pacific Northwest, and Southern Rail) and two “contract grade” categories. Contract grades are described in the “Corn Export System” section on page 41. The two contract grade categories in the Export Cargo Report are:
- “U.S. No. 2” or “U.S. No. 2 or better” contracts specify that the corn must at least meet U.S. No. 2 factor limits or be better than U.S. No. 2 factor limits. This category is designated as U.S. No. 2 o/b.
- “U.S. No. 3” or “U.S. No. 3 or better” contracts specify that the corn must at least meet U.S. No. 3 factor limits or be better than U.S. No. 3 factor limits. This category is designated as U.S. No. 3 o/b.
The sampling process resulted in less than the targeted number of samples in the Southern Rail ECA. However, the U.S. Aggregate averages and standard deviations were weighted by ECA using the original sampling proportions.
New to this 2015/2016 Export Cargo Report is a simple average of the quality factors’ averages and standard deviations of the previous four Export Cargo Reports (2011/2012, 2012/2013, 2013/2014, and 2014/2015). These simple averages are calculated for the U.S. Aggregate and each of the three ECAs and are referred to as “4YA” in the text and summary tables of the report.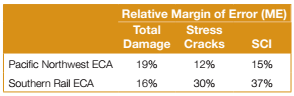
The Relative ME was calculated for each of the quality factors tested for this study at the U.S. Aggregate level and for each of the ECAs. The Relative ME was less than ± 10% for all the quality attributes at the U.S. Aggregate level and for the Gulf ECA. The Relative ME exceeded ± 10% for some quality factors (see table) in the Pacific Northwest and Southern Rail ECAs.
While the level of precision for these quality factors in the two ECAs is less than desired, the levels of Relative ME do not invalidate the estimates. The averages for the quality factors are the best possible unbiased estimates of the true population means. However, they are estimated with greater uncertainty than the quality factors with a Relative ME of less than ± 10%. Footnotes in the summary tables for “Grade Factors and Moisture” and “Physical Factors” indicate the attributes for which the Relative ME exceeds ± 10%. This allows the reader to keep in mind the greater degree of uncertainty of the sample average representing the true population mean.
References in the “Quality Test Results” section to statistical differences were validated by 2-tailed t-tests at the 95% confdence level. The t-tests were calculated:
- Between factors in the 2015/2016 Harvest Report and 2015/2016 Export Cargo Report;
- Between factors in the 2015/2016 Export Cargo Report and 2014/2015 Export Cargo Report, and the 2015/2016 Export Cargo Report and 2013/2014 Export Cargo Report;
- Among factors in the 2015/2016 Export Cargo Report ECAs (Gulf, Pacific Northwest, Southern Rail); and
- Between chemical and physical factors in the 2015/2016 Export Cargo Report contract grades (U.S. No. 2 o/b, U.S. No. 3 o/b).