
Stress Cracks and Stress Crack Index (SCI)
Stress cracks are internal fissures in the horneous (hard) endosperm of a corn kernel. The pericarp (or outer covering) of a stress-cracked kernel is typically not damaged, so the kernel may appear unaffected at first glance, even if stress cracks are present.
Stress crack measurements include “stress cracks” (the percent of kernels with at least one crack) and stress crack index (SCI), which is the weighted average of single, double and multiple stress cracks. “Stress cracks” measures only the number of kernels with stress cracks, whereas SCI shows the severity of cracking. For example, if half the kernels have only single stress cracks, “stress cracks” is 50% and the SCI is 50 (50 x 1). However, if half the kernels have multiple stress cracks (more than two cracks), indicating a higher potential for handling issues, “stress cracks” remain at 50% but the SCI becomes 250 (50 x 5). Lower values for “stress cracks” and the SCI are always more desirable. In years with high levels of stress cracks, the SCI provides valuable information because high SCI values (perhaps 300 to 500) indicate the sample had a very high percentage of multiple stress cracks. Multiple stress cracks are generally more detrimental to quality changes than single stress cracks.
The cause of stress cracks is pressure buildup due to moisture and temperature differences within the kernel’s horneous endosperm. This can be likened to the internal cracks that appear when an ice cube is dropped into a lukewarm beverage. The internal stresses do not build up as much in the soft, floury endosperm as in the horneous endosperm; therefore, corn with a higher percentage of horneous endosperm is more susceptible to stress cracking than softer grain. A kernel may vary in severity of stress cracking and can have one, two or multiple stress cracks. The impact of high levels of stress cracks on various uses include:
- General: Increased susceptibility to breakage during handling. This may lead to processors needing to remove more broken corn during cleaning operations and a possible reduction in grade and/or value.
- Wet Milling: Lower starch yields due to increased difficulty in separating the starch and protein. Stress cracks may also alter steeping requirements.
- Dry Milling: Lower yield of large flaking grits (the prime product of many dry milling operations).
- Alkaline Cooking: Non-uniform water absorption leading to overcooking or undercooking, which affects the process balance.
The most common cause of stress cracks is high-temperature drying that rapidly removes moisture. Growing conditions will affect crop maturity, timeliness of harvest and the need for artificial drying, which, in turn, will influence the degree of stress cracking found from region to region. Then, as corn moves through the market channel, some stress-cracked kernels break, which increases the proportion of broken corn. Concurrently, impacts of kernels on other kernels or on metal surfaces during handling may cause new cracks in kernels. As a result, the percentage of kernels with stress cracks may not remain constant throughout the market channel.
Results: Stress Cracks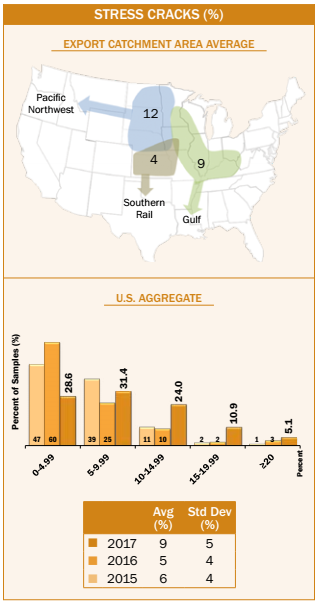
- Average U.S. Aggregate stress cracks (9%) was slightly higher than 2016/2017 (5%) and 2015/2016 (6%), but slightly lower than 5YA (10%). The higher harvest moisture in 2017 (16.6%) versus 2016 (16.1%) may have, in part, contributed to higher stress cracks found this year as compared with 2016/2017.
- Average U.S. Aggregate stress cracks (9%) was slightly higher than the 2017 harvest samples (5%). Average U.S. Aggregate stress cracks has increased from 1 to 4 percentage points between harvest and export for each of the last three years and for 5YA.
- Stress cracks in the export samples (with a range of 0 to 36% and a standard deviation of 5%) were more uniform than in the 2017 harvest samples (with a range of 0 to 90% and a standard deviation of 8%).
- Of the 2017/2018 export samples, 16.0% had 15% or higher stress cracks, compared with only 5% in 2016/2017 and 3% in 2015/2016. This indicates more samples had 15% or higher stress cracks in 2017/2018 than in the previous two years.
- Stress cracks averages were 9%, 12% and 4% for the Gulf, Pacific Northwest and Southern Rail ECAs, respectively. The stress cracks standard deviation was 6% for the Gulf and Pacific Northwest ECAs and 3% for the Southern Rail ECA.
- Average stress cracks were lower for contracts loaded as U.S. No. 2 o/b (8%) than for contracts loaded as U.S. No. 3 o/b (11%).
Results: Stress Crack Index (SCI)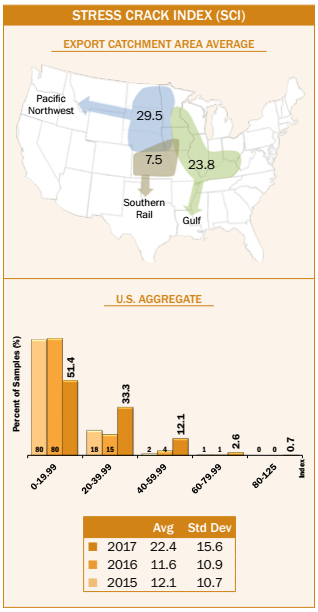
- Average U.S. Aggregate stress crack index (SCI) (22.4) was slightly higher than 2016/2017 (11.6) and 2015/2016 (12.1), but slightly lower than 5YA (25.8).
- SCI in the export samples (with a range of 120 and a standard deviation of 15.6) had more variability than 2016/2017 (with a range of 90 and a standard deviation of 10.9) and 2015/2016 (with a range of 64 and a standard deviation of 10.7). However, the 2017/2018 samples had a standard deviation that was lower than the 5YA standard deviation of 18.5.
- Average U.S. Aggregate SCI at export (22.4) was slightly higher than the average U.S. Aggregate SCI found at harvest (13.7).
- Average SCI was lowest for the Southern Rail ECA (7.5) and highest for the Pacific Northwest ECA (29.5). Average SCI for the Gulf ECA was 23.8.
- SCI standard deviations across ECAs were 17.2, 15.5 and 9.3 for the Gulf, Pacific Northwest and Southern Rail ECAs, respectively.
- In 2017/2018, 48.7% of the samples had SCI of 20 or higher, compared with 20% in 2016/2017 and 21% in 2015/2016. This indicates more samples had double or multiple stress cracks in 2017/2018 than in the two previous years.
- SCI for contracts loaded as U.S. No. 2 o/b (21.1) was slightly lower than contracts loaded as U.S. No. 3 o/b (30.4).