Overview
The key points for the survey design and sampling and statistical analysis for this 2017/2018 Export Cargo Report are as follows:
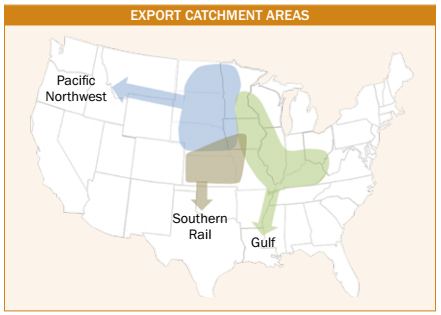
- Following the methodology developed for the previous six Export Cargo Reports, samples were proportionately stratified according to Export Catchment Areas (ECAs) – the Gulf, Pacific Northwest and Southern Rail.
- To achieve no more than a ±10% relative margin of error (Relative ME) for the U.S. Aggregate level and to ensure proportionate sampling from each ECA, the targeted number of total samples was 430 samples, to be collected from the ECAs as follows: 276 from the Gulf, 87 from the Pacific Northwest and 67 from the Southern Rail.
- Weighted averages and standard deviations following standard statistical techniques for proportionate stratified sampling were calculated for the U.S. Aggregate and the three ECAs.
- Southern Rail ECA samples were provided by any of several official agencies designated by the U.S. Department of Agriculture (USDA) Federal Grain Inspection Service (FGIS) that inspect and grade rail shipments of corn destined for export to Mexico. Gulf and Pacific Northwest samples were collected by FGIS field offices at ports in the respective ECAs.
- To evaluate the statistical validity of the number of samples surveyed, the Relative ME was calculated for each of the quality attributes at the U.S. Aggregate and the three ECA levels. The Relative ME for each of the quality factor results was not more than ±10% at the U.S. Aggregate level. The Relative ME exceeded ±10% for SCI in the Gulf ECA; total damage, stress cracks and SCI in the Pacific Northwest ECA; and stress cracks and SCI in the Southern Rail ECA (see table on page 59).
- Two-tailed t-tests at the 95% confidence level were calculated to measure statistical differences between the 2017/2018 and 2016/2017 and the 2017/2018 and 2015/2016 quality factor averages.