Chemical Composition
The chemical composition of corn consists primarily of protein, starch and oil. Although they are not grade factors, these attributes are of significant interest to end users. They provide information related to nutritional value for livestock and poultry feeding, for wet milling uses and for other processing uses of corn. Unlike many physical attributes, chemical composition values are not expected to change significantly during storage or transit. Variability is usually less at export than at harvest as a result of commingling from many originations.
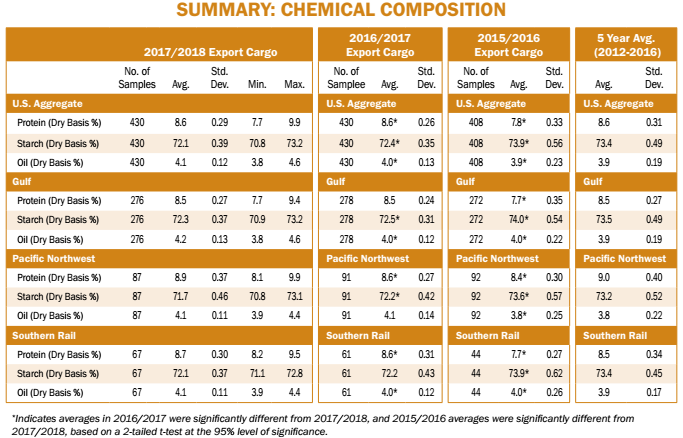
Summary: Chemical Composition
- Average U.S. Aggregate protein concentration at export (8.6%) was the same as 2016/2017, higher than 2015/2016, and the same as 5YA and the 2017 harvest average.
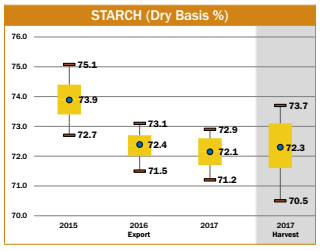
- Average U.S. Aggregate starch concentration (72.1%) was slightly lower than 2016/2017, lower than 2015/2016 and 5YA, and similar to the 2017 harvest average.
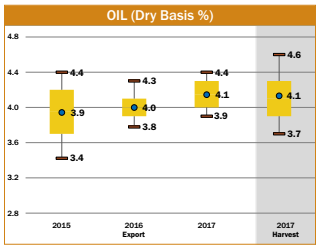
- Average U.S. Aggregate oil concentration (4.1%) was higher than 2016/2017, 2015/2016 and 5YA, but the same as the 2017 harvest average.
- The standard deviations for protein, starch and oil concentrations were lower and ranges were narrower for the export samples than for the harvest samples.
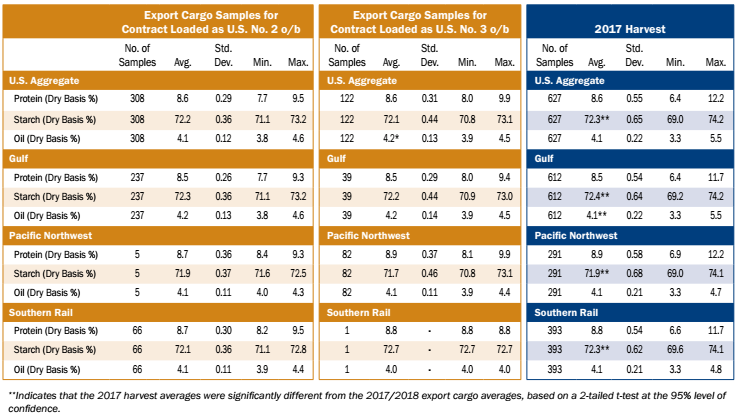
- Average protein and starch concentrations for contracts loaded as U.S. No. 2 o/b were similar to average protein and starch concentrations for contracts loaded as U.S. No. 3 o/b; however, average oil concentration was lower for contracts loaded as U.S. No. 2 o/b than for contracts loaded as U.S. No. 3 o/b.
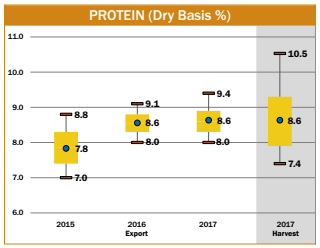
Protein
Protein is very important for poultry and livestock feeding because it supplies essential sulfur-containing amino acids and helps to improve feed conversion efficiency. Protein concentration is usually inversely related to starch concentration. Results are reported on a dry basis.
Results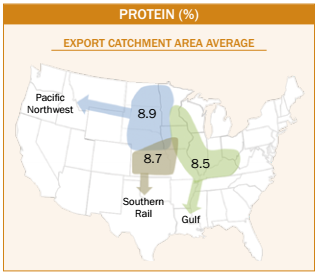
- Average U.S. Aggregate protein concentration (8.6%) was the same as 2016/2017 and 5YA, but higher than 2015/2016 (7.8%). The average U.S. Aggregate protein concentration at export was the same as the average U.S. Aggregate protein concentration for 2017 harvest (8.6%).
- The 2017/2018 export samples (standard deviation of 0.29%) were more uniform than the 2017 harvest samples (standard deviation of 0.55%). In addition, the range of protein concentrations at export (7.7 to 9.9%) was narrower than at harvest (6.4 to 12.2%). The uniformity is due, in part, to grains becoming more homogenous as they are aggregated from numerous harvest-level sources.
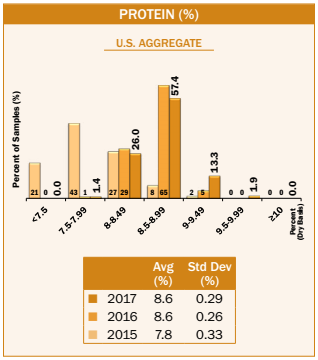
- The 2017/2018 export samples were distributed with 72.6% of protein concentrations at or above 8.5%, compared with 70% of the 2016/2017 samples and 10% of the 2015/2016 samples.
- The Gulf ECA (8.5%) had a lower average protein concentration than the Pacific Northwest (8.9%) and the Southern Rail (8.7%) ECAs.
- Average protein concentration for contracts loaded as U.S. No. 2 o/b (8.6%) was the same as for contracts loaded as U.S. No. 3 o/b.
Starch
Starch is an important factor for corn used by wet millers and dry-grind ethanol producers. High starch concentration is often indicative of good growing and filling conditions and reasonably moderate kernel densities. Starch concentration is usually inversely related to protein concentration. Results are reported on a dry basis.
Results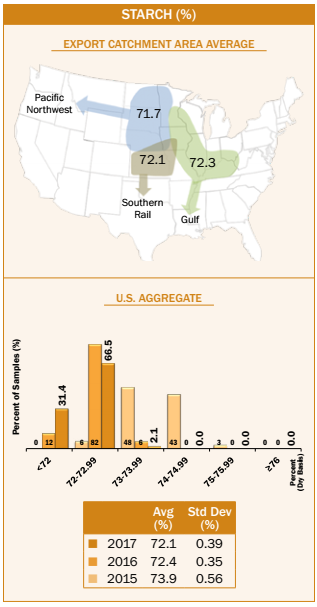
- Average U.S. Aggregate starch concentration (72.1%) was slightly lower than 2016/2017 (72.4%), and lower than 2015/2016 (73.9%) and 5YA (73.4%). Average starch concentration at export (72.1%) was similar to harvest (72.3%).
- The standard deviation for starch concentration of the 2017/2018 export samples (0.39%) was lower than the standard deviation of the 2017 harvest samples (0.65%).
- Starch concentrations were distributed with 68.6% at or above 72.0%, compared with 88% in 2016/2017 and 100% in 2015/2016. This indicates fewer 2017/2018 samples had 72.0% or higher starch concentration compared with the previous two years.
- The Gulf ECA had the highest average starch concentration (72.3%), in comparison to the Pacific Northwest (71.7%) and Southern Rail (72.1%) ECAs. Average starch concentrations were also the highest for the Gulf ECA in 2016/2017, 2015/2016 and 5YA. The Gulf ECA had the highest starch and the lowest protein among ECAs. This indicates the typical inverse relationship between starch and protein.
- Average starch concentration for contracts loaded as U.S. No. 2 o/b (72.2%) was similar to contracts loaded as U.S. No. 3 o/b (72.1%).
Oil
Oil is an essential component of poultry and livestock rations. It serves as an energy source, enables fat-soluble vitamins to be utilized and provides certain essential fatty acids. Oil is also an important co-product of corn wet and dry milling. Results are reported on a dry basis.
Results
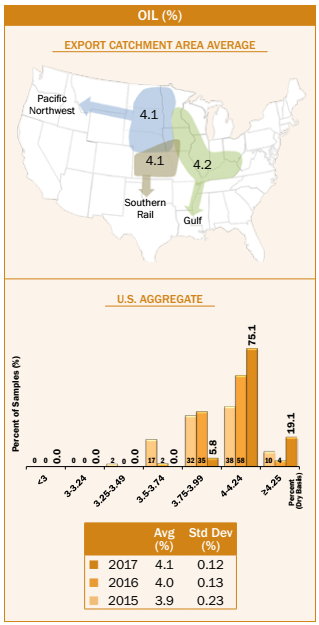
- Average U.S. Aggregate oil concentration (4.1%) was higher than 2016/2017 (4.0%), 2015/2016 (3.9%) and 5YA (3.9%).
- The average oil concentration for the 2017/2018 export samples was the same as the 2017 harvest samples (both 4.1%), while the standard deviation at export (0.12%) was lower than at harvest (0.22%).
- The 2017/2018 samples showed a higher percentage of samples above 4% oil than the previous two years. A total of 94.2% of the 2017/2018 samples contained at least 4% oil, in contrast to 62% in 2016/2017 and 48% in 2015/2016.
- Average oil concentration for the Gulf ECA (4.2%) was slightly higher than for the Pacific Northwest (4.1%) and Southern Rail (4.1%) ECAs.
- Average U.S. Aggregate and Gulf ECA oil concentrations for contracts loaded as U.S. No. 2 o/b (4.1%) were lower than for contracts loaded as U.S. No. 3 o/b (4.2%).