Grade Factors
The U.S. Department of Agriculture (USDA) Federal Grain Inspection Service (FGIS) has established numerical grades, definitions and standards for measurement of many quality attributes. The attributes which determine the numerical grades for corn are test weight, broken corn and foreign material (BCFM), total damage and heat damage. The table for “U.S. Corn Grades and Grade Requirements” is provided on page 66 of this report.
Summary: Grade Factors and Moisture
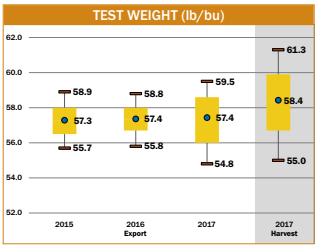
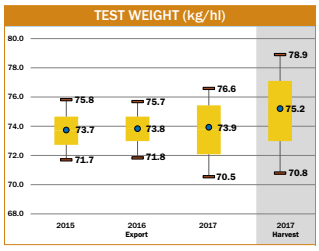
- Average U.S. Aggregate test weight (57.4 lb/bu or 73.9 kg/hl) was the same as 2016/2017, similar to 2015/2016 and 5YA, but well above the limit for U.S. No. 1 grade corn (56 lb/bu).
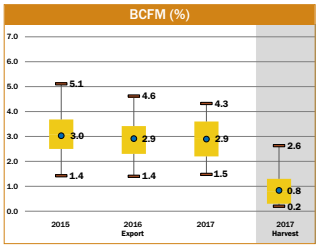
- Average U.S. Aggregate BCFM (2.9%) was the same as 2016/2017 and 5YA. Approximately 60% of the export samples contained levels at or below the maximum allowed for U.S. No. 2 grade (3.0%), and 92.5% were at or below the limit for U.S. No. 3 grade (4.0%).
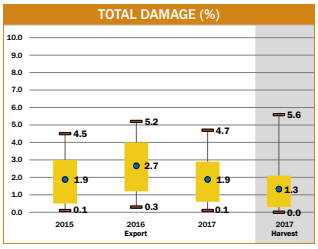
- Average U.S. Aggregate total damage (1.9%) was lower than 2016/2017, same as 2015/2016 and lower than 5YA, and was well below the limit for U.S. No. 1 grade (3.0%). Of the export samples, 86.5% had 3.0% or less damaged kernels, meeting the requirement for U.S. No. 1 grade. In addition, 98.1% were at or below the limit for U.S. No. 2 grade (5.0%).
- The Pacific Northwest ECA at export had the lowest average total damage among the three ECAs for each of the last three years and for 5YA.
- Average U.S. Aggregate heat damage was 0.0% for 2017/2018, the same as the previous two years and 5YA.
- Test weight, total damage and heat damage averages for contracts loaded as U.S. No. 2 o/b and for contracts loaded as U.S. No. 3 o/b were better than U.S. No. 1 grade limits.
- Average BCFM for contracts loaded as U.S. No. 2 o/b was below the limit for U.S. No. 2. Average for contracts loaded as U.S. No. 3 o/b was higher than contracts loaded as U.S. No. 2 o/b, but still below the U.S. No. 3 grade limit.
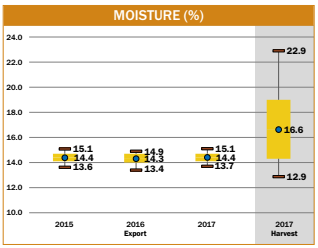
- Average U.S. Aggregate moisture content (14.4%) was slightly higher than 2016/2017, and the same as 2015/2016 and 5YA.
- A total of 31.2% of the samples had moisture content above 14.5%, which was higher than 2016/2017 and 2015/2016. Moisture standard deviation (0.29%) was lower in 2017/2018 than the previous two years and 5YA.
- The Pacific Northwest ECA average moisture (14.2%) was lower than the Gulf (14.5%) and Southern Rail (14.3%) ECAs. The Pacific Northwest ECA had the lowest average moisture content among ECAs for each of the last three years and for 5YA.