
Export Cargo Quality Highlights
The average aggregate quality of the corn assembled for export early in the 2017/2018 marketing year was better than or equal to U.S. No. 2 on all grade factors, and average moisture content was slightly higher than 2016/2017. Chemical composition attributes indicated similar protein, lower starch and higher oil concentrations than 2016/2017. The early 2017/2018 corn exports had larger kernels and higher stress cracks, true density and horneous endosperm, but lower whole kernels than 2016/2017. In addition, all of the samples’ test results for aflatoxin and deoxynivalenol (DON) or vomitoxin were below the U.S. Food and Drug Administration (FDA) action and advisory levels, respectively. Notable U.S. Aggregate quality attributes of the 2017/2018 export samples include:
Grade Factors and Moisture
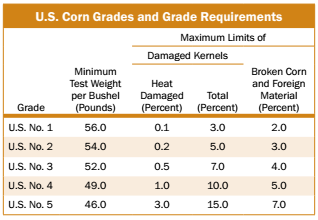
- Same average test weight of 57.4 lb/bu (73.9 kg/hl) as 2016/2017, indicating overall good quality, with about 84% of the samples at or above the limit for U.S. No. 1 grade.
- Same average broken corn and foreign material (BCFM) (2.9%) as 2016/2017 and 5YA[1], slightly lower than the maximum limit for U.S. No. 2 grade (3.0%). BCFM predictably increased from 0.8% to 2.9%, as the crop moved from harvest through the market channel to export.
- Lower average total damage at export (1.9%) than 2016/2017 (2.7%) and 5YA (2.1%). The majority (98.1%) of the samples were below the limit for U.S. No. 2 grade.
- Average heat damage was 0.0%, the same as 2016/2017 and 5YA, indicating good management of drying and storage of corn throughout the market channel.
- Slightly higher average moisture (14.4%) than 2016/2017 (14.3%), but same as 5YA.
[1] 5YA represents the simple average of the previous five years of quality factor results from the 2012/2013, 2013/2014, 2014/2015, 2015/2016 and 2016/2017 Corn Export Cargo Quality Reports.
Chemical Composition
- Same average protein concentration (8.6% dry basis) as 2016/2017 and 5YA.
- Slightly lower average starch concentration (72.1% dry basis) than 2016/2017 (72.4%) and lower than 5YA (73.4%).
- Higher average oil concentration (4.1% dry basis) than 2016/2017 (4.0%) and 5YA (3.9%).
Physical Factors
- Slightly higher average stress cracks (9%) than 2016/2017 (5%), but slightly lower than 5YA (10%). The majority of the export samples (84.0%) had less than 15% stress cracks, which should result in relatively low rates of breakage during handling, but may be higher than last year.
- Slightly higher average stress crack index (SCI) (22.4) than 2016/2017 (11.6), but slightly lower than 5YA (25.8). The higher SCI and stress crack percentages in 2017/2018 than in 2016/2017 may be due, in part, to higher average moisture at the 2017 harvest than at the 2016 harvest.
- Higher average 100-kernel weight (36.07 g) than 2016/2017 (35.26 g) and 5YA (35.37 g), indicating larger kernels in 2017/2018 than last year and 5YA.
- Higher average kernel volume (0.28 cm3) than 2016/2017 (0.27 cm3) and 5YA (0.27 cm3).
- Slightly higher average true density (1.287 g/cm3) than 2016/2017 (1.285 g/cm3), yet similar to 5YA (1.288 g/cm3).
- Lower average percent of whole kernels (84.4%) than 2016/2017 (88.2%) and 5YA (88.9%).
- Average horneous (hard) endosperm of 81%, higher than 2016/2017 (79%), but slightly lower than 5YA (82%), indicating slightly harder corn in 2017/2018 than in 2016/2017.
Mycotoxins
- All of the export samples tested below the U.S. Federal Drug Administration (FDA) action level of 20 ppb for aflatoxins. A higher proportion of the export samples had no detectable levels of aflatoxins than in 2016/2017.
- 100% of the corn export samples tested below the 5 ppm FDA advisory level for deoxynivalenol (DON) or vomitoxin (same as 2016/2017). There were fewer samples showing levels of DON above the FGIS “Lower Conformance Level” of 0.5 ppm in 2017/2018 than in 2016/2017.