
Survey Overview
The U.S. Grains Council Corn Export Cargo Quality Report 2011/12 provides accurate, unbiased information about the quality of U.S. yellow commodity corn as it is assembled for export. This report provides the results of tests on corn samples collected during the U.S. government-licensed sampling and inspection process for U.S. corn waterborne export shipments. Corn quality information is important to foreign buyers as they make decisions about purchase contracts and processing needs for corn for feed, food or industrial use. This information is important also to all of the other stakeholders in the corn value chain: seed companies, corn producers, handlers, shippers, traders and processors.
The earlier U.S. Grains Council Corn Harvest Quality Report 2011/12 measured the quality of the corn as it entered the U.S. marketing system. However, the condition of the corn changes as it passes through the U.S. marketing system, being commingled with corn from other locations, aggregated into trucks, barges and rail cars, stored, and loaded and unloaded several times. For this reason, the Harvest Quality Report and the Export Cargo Quality Report should be studied together in order to understand corn quality changes that take place from harvest to export. A review of how corn quality changes from the field to the ocean vessel is provided in the “Corn Export System” section.
As with the Harvest Quality Report, this report is the first of what is intended to be an annual survey of the quality of the U.S. corn exports early in the marketing year. These two reports include information on grades and standards factors and moisture which may be compared to the annual U.S. Grains Exports: Quality Report published by the Federal Grain Inspection Service (FGIS). Beyond that, these reports provide information on other important quality factors that have not been surveyed systematically in the past. Without the ability to compare the 2011/12 results with previous years, these reports should be interpreted with caution. However, this year’s reports will establish a benchmark for comparison of subsequent corn exports early in theshipping season. (Corn from the 2011 harvest generally is shipped during the period of November through August.). As these reports are compiled over several years, the Export Cargo Quality Report will gain increased value for all stakeholders in the corn value chain – from seed to consumer -by enabling them to see patterns of corn quality based on growing, drying, handling, storage, and transport conditions across the years.
The results from this year’s survey of corn exports from the 2011/12 crop show relatively good quality at the ports, with high test weight and low moisture. Uniformity increased as the corn moved through the market channel. Low stress cracks and total damage are indicative of corn cargoes that will perform well in terms of retaining quality during transit. Although we do not have comparable data for previous years, we consider this to be a good quality crop based on our years of experience in observing corn quality.
This Export Cargo Quality Report is based on 379 yellow commodity corn samples collected in key export areas. Samples were collected from corn export cargoes as they underwent the standard federal inspection and grading process performed by the U.S. Department of Agriculture’s Grain Inspection, Packers and Stockyards Administration’s (GIPSA) Federal Grain Inspection Service (FGIS). The objective of this report is to survey corn quality at export and to provide information about the variability of the quality characteristics within the key export areas.
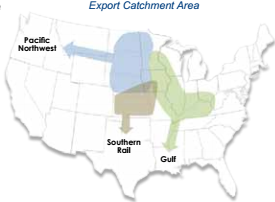
The sample test results are reported at the U.S. aggregate level (U.S. Aggregate). In addition, the key export ports are divided into three general groupings that we label Export Catchment Areas (ECAs). These three ECAs are identified by the three major pathways to export markets:
- The Gulf ECA consisting of areas that typically export corn through U.S. Gulf ports,
- The Pacific Northwest ECA that includes areas exporting corn through Pacific Northwest and California ports, and
- The Southern Rail ECA consisting of areas generally exporting corn to Mexico.
The sample test results are also summarized by “contract grade” categories. Since the limits on all official grade quality attributes (such as test weight and total damage) cannot always be met simultaneously, some factors may be better than the limit for a specified grade, but never worse. As a result, contracts are often written as “U.S. No. 2 or better,” allowing some (or all) factors to be better than required by the grade specification while other factors are at or near the limit for that grade. The two contract grade categories reported in the Export Cargo Quality Report are:
- “U.S. No. 2” or “U.S. No. 2 or better” contracts specify the corn must at least meet U.S. No. 2 factor limits or be better than U.S. No. 2 factor limits. This category is designated as U.S. No. 2 o/b.
- “U.S. No. 3” or “U.S. No. 3 or better” contracts specify that the corn must at least meet U.S. No. 3 factor limits or be better than U.S. No. 3 factor limits. This category is referred to as U.S. No. 3 o/b.
For the Export Cargo Quality Report we collected 379 samples from corn shipments during January through March 2012 to generate statistically valid results for the U.S. Aggregate and by ECA. Our objective was to obtain enough samples at the ECA level to estimate quality factor averages of the corn exports with a relative margin of error (Relative ME) less than ± 10%, a reasonable target for biological data such as these factors. Details of the statistical sampling and analysis methods are presented in the “Survey and Statistical Analysis Methods” section.
Limitations of this report. This report does not predict the actual quality of any cargo or lot of corn, and it is important for all players in the value chain to understand their own contract needs and obligations. This report does not explain the reasons for changes in quality factors from the Harvest Report to the Export Cargo report. Many factors including weather, genetics, and grain handling affect changes in quality in complex ways. Sample test results can vary significantly depending on the ways in which a lot of corn was loaded onto a conveyance and the method of sampling used. The sampling method used by FGIS is explained in the section beginning on page 27. Different sampling methods can yield different testing results. The FGIS sampling method provides a truly represtentative sample, while other commonly used methods may yield non-representative samples of a lot due to the uneven distribution of corn in a truck or in the hold of a vessel.