Chemical Composition
Chemical composition of corn is important because the components of protein, starch and oil are of significant interest to the industry. The chemical composition attributes are not grade factors. However, they provide additional information related to nutritional value for livestock and poultry feeding, for wet milling uses, and other processing uses of corn. Unlike many physical attributes, chemical composition values were not expected to change significantly during storage or transport.
Protein
Protein is very important for poultry and livestock feeding. It helps with feeding efficiency and supplies essential sulfur-containing amino acids. Protein is usually inversely related to starch content. Results are reported on a dry basis.
Highlights
- The U.S. Aggregate protein was unchanged between Harvest and Export Cargo (8.7%) samples from the 2011 corn crop.
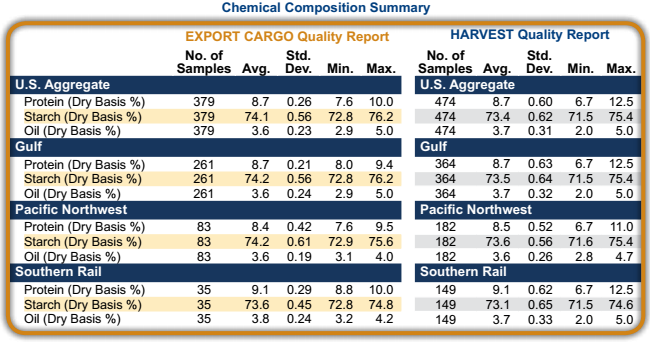
- U.S. Aggregate protein content at export was more uniform than at the Harvest Report level, with a tighter range from 7.6% to 10.0% and a smaller standard deviation of 0.26%.
- U. S. Aggregate protein was distributed with 63.3% between 8.5% and 8.99% and 18.3% above 9.0%.
- Protein averages were significantly different for the Gulf, Pacific Northwest, and Southern Rail ECAs – 8.7%, 8.4%, and 9.1%, respectively. The Southern Rail ECA had the highest average protein in the Harvest Report also.
- Protein percentages found for contracts loaded as U.S. No. 2 o/b or U.S. No. 3 o/b were both 8.7%.
Starch
Starch is an important factor for corn used by wet millers and dry-grind ethanol manufacturers. High starch content is often indicative of good kernel maturation/filling conditions and reasonably high kernel densities. Starch is usually inversely related to protein content. Results are reported on a dry basis.
Highlights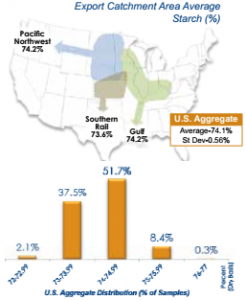
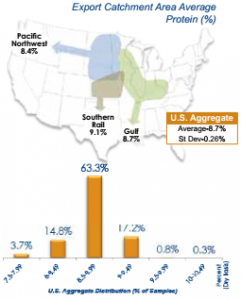
- The U.S. Aggregate starch averaged 74.1% in the Export Cargo Report, slightly higher than at the Harvest Report level.
- U.S. Aggregate starch at export ranged from 72.8 to 76.2% and had a standard deviation of 0.56%. This was a slightly tighter range and smaller standard deviation than for the Harvest Report samples, indicating more uniformity.
- Of all the samples, 60.4% had a starch content equal to or above 74%.
- The starch averages for the Gulf, Pacific Northwest, and Southern Rail ECAs were 74.2%, 74.2% and 73.6%, respectively, with no significant difference in starch content between the Gulf and Pacific Northwest ECAs.
- Virtually no difference was found in starch percentages between contracts loaded as U.S. No. 2 o/b (74.1%) and contracts loaded as U.S. No. 3 o/b (74.2%).
Oil
Oil is an essential component of poultry and livestock rations. It serves as an energy source, enables fatsoluble vitamins to be utilized, and provides certain essential fatty acids. Oil is also an important by-product of corn wet and dry milling. Results are reported on a dry basis.
Highlights
U.S. Aggregate oil averaged 3.6% at the export level, lower than the 3.7% found in the Harvest Report samples.
Export samples’ oil content was more uniform than in the Harvest Report with values ranging from 2.9 to 5.0% and a standard deviation of 0.23%.
U.S. Aggregate oil was distributed with 51.5% of the sample results falling between 3.5% and 3.74%, and 23.2% of the samples at 3.75% or higher.
Oil averages for the Gulf, Pacific Northwest, and Southern Rail ECAs were 3.6%, 3.6% and 3.8%, respectively.
The average oil content for contracts loaded as U.S. No. 2 o/b was slightly higher than for contracts loaded as U.S. No. 3 o/b (3.62% versus 3.57% respectively, when shown to the 100th decimal place).
Chemical Composition Summary
Highlights
- U.S. Aggregate protein averaged 8.7% in both the Export and Harvest samples, but protein in the Export Cargo samples was more uniform than in the Harvest Report.
- Corn protein averages for the Gulf, Pacific Northwest, and Southern Rail ECAs were significantly different at 8.7%, 8.4%, and 9.1%, respectively.
- U.S. Aggregate starch averaged 74.1% in the Export Report, compared to 73.4% in the Harvest Report. Starch was 74.2% for Gulf and Pacific Northwest ECA’s but lower (73.6%) for Southern Rail ECA.
- U.S. Aggregate export oil content (3.6%) was notably lower from 3.7% found in the Harvest Report and significantly higher in the Southern Rail ECA than in the Gulf and Pacific Northwest ECAs.
- Protein, starch and oil did not vary between contracts loaded as U.S. No. 2 o/b and as U.S. No. 3 o/b.