Grade Factors and Moisture
The USDA’s Federal Grain Inspection Service (FGIS) has established numerical grades, definitions and standards for measurement of many quality factors. The attributes which determine the numerical grades are test weight, broken corn and foreign material (BCFM), total damage, and heat damage. The table, “U.S. Official Corn Grades and Grade Requirements” corn grades and grade requirements areis provided summarized in the “Grade Requirements and Conversions” section of this report. U.S. law requires that these official grades and grade requirements be reviewed every four years, with inputs welcomed from all stakeholders.
Moisture content is reported on official grade certificates, but does not determine which numerical grade will be assigned to the sample.
Test Weight
Test weight (weight per volume) is a measure of bulk density and is often used as a general indicator of overall quality and as a gauge of endosperm hardness to alkaline cookers and dry millers. It is highly correlated with true density and reflects kernel hardness and kernel maturity. Test weight is initially impacted by genetic differences in the structure of the kernel. However, it is also affected by moisture content, method of drying, physical damage to the kernel (broken kernels and scuffed surfaces), foreign material in the sample, kernel size, stress during the growing season, and microbiological damage. High test weight at the port generally indicates high quality, high percent of horneous (or hard) endosperm and sound, clean corn. In addition, high test weight corn will allow for a greater quantity of corn for a given volume of space in the hold than the same weight of corn with a lower test weight.
Highlights
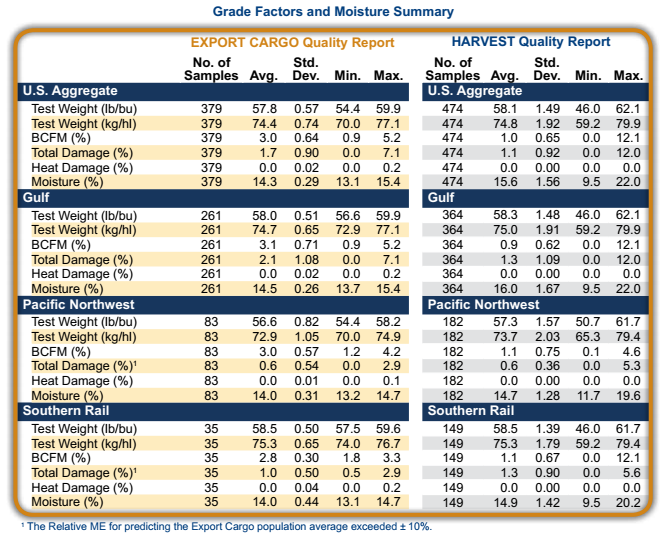
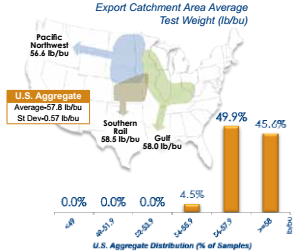
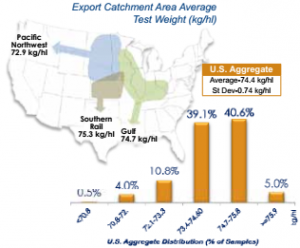
- The U.S. Aggregate average test weight of 57.8 lb/bu (74.4 kg/hl) indicates overall good quality and is nearly 2 lb/bu above the grade limit for U.S. No. 1 corn (56 lb).
- U.S. Aggregate test weight of Export Report samples was lower than test weight Harvest Report samples.
- As corn is commingled moving through the marketing channel, test weight becomes more uniform with lower standard deviation and smaller range between maximum and minimum values.
- Over 95% of all samples’ test weights were at or above the minimum for U.S. No. 1 grade, and 100% were above the limit for U.S. No. 2 grade.
- The Southern Rail ECA had higher average test weight. This may be partly because all Southern Rail samples were loaded as U.S. No. 2 o/b.
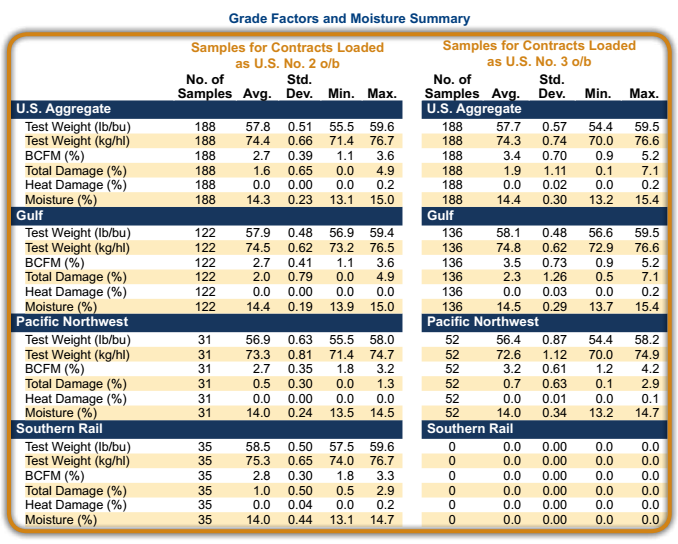
- Differences in test weight among sublots loaded as U.S. No. 2 o/b and as U.S. No. 3 o/b were small since all average values were above U.S. No. 2 grade.
Broken Corn and Foreign Material (BCFM)
Broken corn and foreign material (BCFM) is an indicator of the amount of 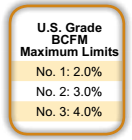 clean, sound corn available for feeding and processing. The lower the percentage of BCFM, the less foreign material and/or fewer broken kernels are in a sample. As corn moves through the market channel, each impact of the grain during handling, and transporting increases the amount of broken corn. As a result, the average BCFM in most shipments of corn will be higher at the port than at the country elevator level.
Broken corn (BC) is defined as corn and corn material small enough to pass 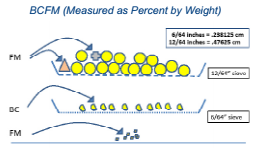 through a 12/64th inch round-hole sieve, but too large to pass through a 6/64th inch round-hole sieve.
Foreign material (FM) is defined as any non-corn pieces too large to pass through a 12/64th inch sieve, as well as all fine material small enough to pass through a 6/64th inch sieve.
The diagram to the right illustrates the measurement of broken corn and foreign material for the U.S. corn grading standards.
Highlights
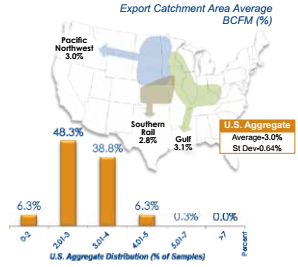
- The increase in BCFM between the Harvest Report (1.0%) and Export Cargo Report (3.0%) is typically influenced by increased breakage during drying and handling.
- Corn arriving at the export point was cleaned and commingled to meet the grade limits.
- BCFM at export was significantly lower in the Southern Rail ECA possibly due to the fact that Southern Rail loaded only U.S. No. 2 o/b.
- U.S. Aggregate BCFM in each grade was below the limits for the respective contract grade (2.7% on U.S. No. 2 o/b and 3.4% on U.S. No. 3 o/b).
- The BCFM from samples in U.S. No. 2 o/b were significantly lower than for U.S. No. 3 o/b as required in the grade limits.
Total Damage
Total damage is the percentage of kernels and pieces of kernels that are 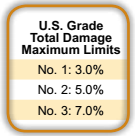 visually damaged in some way, including damage from heat, frost, insect, sprout, disease, weather, ground, germ, and mold. Most of these types of damage result in some sort of discoloration or change in kernel texture. Damage does not include broken pieces of grain that are otherwise normal in appearance. Mold damage and the associated potential for mycotoxins is the damage factor of greatest concern. Mold damage is usually associated with higher moisture content and high temperature during growing and/or storage conditions.
Corn with low levels of total damage is more likely to arrive at destination in good condition than corn with high levels of total damage. High levels of total damage have the potential of increasing moisture and microbiological activity during transport.
Highlights
- The average levels for total damage increased slightly between the farm
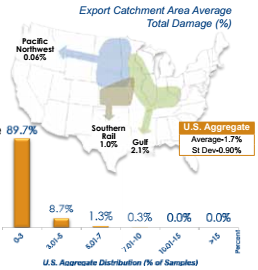 Harvest samples (1.1%) and eExport Cargo samples (1.7%) – a good record for over-winter storage.
 - 89.7% of the export samples had 3% or less damaged kernels – well below the limit for U.S. No.3 (5%).
- Increased total damage at export was greatest in the Gulf ECA most likely due to higher moisture corn at harvest going into storage.
- U.S. Aggregate total damage was below the limits for each contract grade (1.6% for U.S. No 2 o/b and 1.9% on U.S. No. 3 o/b).
- Total damage from samples in U.S. No. 2 o/b were significantly lower than for U.S. No. 3 o/b as required in th
e grade limits.
Heat Damage
Heat damage is a subset of total damage in corn grades and has separate allowances in the U.S. Grade standards. Heat damage can be caused by microbiological activity in warm, moist grain or by high heat applied during drying. Low levels of heat damage may indicate the corn has been stored at appropriate moisture and temperatures prior to delivery to the port.
Highlights
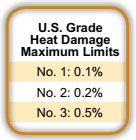
- There was almost no heat damage reported in any of the samples, indicating good management of the crop during storage.
Moisture
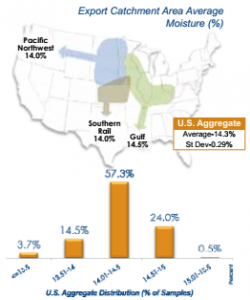
Moisture content affects the amount of dry matter being sold and purchased. In addition, the average moisture level and variability in a shipment of corn affect its quality arriving at destination. Corn is typically stored in closed, nearly airtight holds during the ocean voyage, and few bulk carriers have the ability to aerate the grain mass during transit. This lack of aeration can create an ideal environment for pockets of high moisture to initiate microbiological activity. In addition, temperature variations in the grain mass can cause moisture migration, resulting in warm moist air condensing on colder surfaces of grain, near sidewalls, or on the underside of hatch covers, which can lead to development of spoilage or hot spots. Thus, uniformity of moisture content among sublots and average moisture values below 14.5% are important for minimizing the risk of “hot spots” developing during transit. “Hot spots” are small pockets of corn where the moisture content and temperature become abnormally higher than the average for the cargo.
Highlights
- U.S. Aggregate moisture content decreased between Harvest (15.6%) and Export Cargo samples (14.3%) due mainly to drying and conditioning in the market channel following harvest deliveries.
- Moisture content variability among samples decreased as the corn moved through the market channel with a tighter range and lower variability. This was a result of drying and management to meet the export contract specifications.
- More than 75.5% of the samples had moisture at 14.5% or below, which indicates most cargoes will transport with little microbiological activity.
- Average moisture content was highest at the Gulf ports most likely as a result of higher moisture contents at harvest in that ECA.
- Moisture was slightly lower in the Pacific Northwest and Southern Rail ECAs, probably as a result of drier conditions during harvest.
- Moisture is specified in the contract by the buyer, and as a result, differences in moisture content among grades was less than 0.5 percentage points (ranging from 14.0 to 14.4%), still below safe transit levels especially during colder temperatures.
Grade Factors and Moisture Summary
Highlights
- Quality of the corn at export was good, with average values generally better than grade limits and contract specifications. In addition, Export Cargo Report sample quality was more uniform than the Harvest Report samples.
- Test weight was high with U.S. Aggregate samples averaging 57.8 lb/bu (74.4 kg/hl).
- Average BCFM at export was below the limits for the respective grades.
- Average total damage and heat damage were well below the limits for the grade being loaded.
- Moisture contents were lowered in the market channel to meet the contract specifications and were generally at levels for safe transit.