
Survey Design and Sampling
Overview
The key points for the statistical sample design and sampling process for this Export Cargo Quality Report are as follows
- Following the process developed for the earlier Harvest Quality Report, we stratified the samples according to Export Catchment Areas (ECAs) – the Gulf, Pacific Northwest, and Southern Rail.
- To achieve a maximum 10% relative margin of error (Relative ME) at the 95% confdence level and to ensure proportional sampling from each ECA, we specified the targeted number of total samples to be 394 samples collected from the ECAs as follows: 261 from the Gulf, 83 from Pacific Northwest, and 50 from Southern Rail.
- Samples from the port of Galveston, Texas, were collected for the Southern Rail ECA. This is because the inspection samples from interior rail shipments are not collected and inspected by USDA’s Federal Grain Inspection Service (FGIS), but by any of several official agencies designated by FGIS, and the inspection data are not stored on the FGIS computer system, therefore, making the logistics for using interior shipments infeasible. FGIS and industry experts believe corn being exported by vessel from Texas is fairly representative of corn from the Southern Rail ECA.
- Although we calculated, based on the five-year average pace of exports that the samples could be collected over a four-week period, the unexpectedly slow pace of export shipments this season necessitated that we modify the sampling process, doubling the frequency of sampling.
- Export inspections from Texas were so slow that we were not able to collect the targeted number of samples in time for this report. As a result, 35 samples were collected for the Southern Rail. The U.S. Aggregate averages for the quality factors were weighted according to the targeted proportion by ECA.
- To evaluate the statistical validity of the samples, the relative margin of error (Relative ME) was calculated for each of the quality attributes at the U.S. Aggregate and the three ECA levels. The Relative ME for the quality factor results were less than ±10% except for three attributes from the Pacific Northwest and Southern Rail ECAs – total damage, stress cracks percent and stress crack index.
Survey Design
For this Export Cargo Quality Report, the target population was yellow commodity corn from the twelve key U.S. corn producing states representing about 98% of U.S. exports in 2010. A
proportionate stratified sampling
technique was used to ensure a sound statistical sampling of U.S. yellow corn exports. Two key characteristics define the sampling technique for this report: the stratification of the population to be sampled and the sampling proportion per subpopulation or strata.
Stratified sampling involves dividing the survey population of interest into distinct, non-overlapping subpopulations called strata. For the Harvest and Export Cargo Corn Quality Reports, the twelve cornexporting states are divided into three general groupings which we refer to as Export Catchment Areas (ECAs). These three ECAs are identified by the three major pathways to export markets:
- The Gulf ECA consisting of areas that typically export through U.S. Gulf ports,
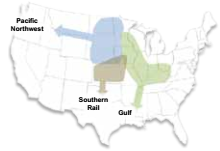
- The Pacific Northwest ECA that includes areas exporting corn through Pacific Northwest and California ports, and
- The Southern Rail ECA consisting of areas generally exporting corn by rail to Mexico.
Using data from the FGIS Export Grain Information System (EGIS), each ECA’s proportion of the total annual yellow corn exports for 2008 through 2010 was calculated and averaged over the three years. This average share of exports was used to determine the sampling proportion (the percent of total samples per ECA) and ultimately, the number of yellow corn samples to be collected from each ECA. The specified sampling proportions for the three ECAs are as follows:
The number of samples collected within each ECA was established so we could estimate the true averages of the various quality factors with a certain level of precision. The level of precision chosen for the Export Cargo Quality Report was a relative margin of error (Relative ME) no greater than ± 10%, estimated with a 95% level of confdence. A Relative ME of ± 10% is a reasonable target for biological data such as these corn quality factors.
To determine the number of samples for the targeted Relative ME, ideally the population variance (i.e., variability of the quality factor in the corn exports) for each of the quality factors should be used. The more variation among the levels or values of a quality factor, the more samples needed to estimate the true mean with a given confdence limit. In addition, the variances of the quality factors typically differ from one another. As a result, different sample sizes for each of the quality factors would be needed for the same level of precision.
We did not know the population variances for any of the ffteen quality factors evaluated for this year’s corn exports. When population variances are not known, variance estimates from similar data sets or studies are used. For a proxy for this year’s study, we calculated the variances and ultimately the estimated number of samples needed for the Relative ME of ± 10% for four quality factors – test weight, moisture, broken corn and foreign material (BCFM), and total damage – using the 2010 EGIS corn export data. Total damage had the largest Relative ME of the four factors. Based on these data, a minimum sample size of 50 would be needed to estimate the true average of total damage with our desired level of precision.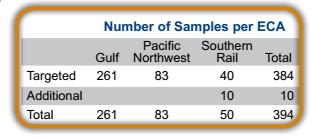
We did not have data for the remaining eleven quality factors to estimate their variances or sample sizes needed for our targeted Relative ME. Consequently, it is our intent to use this year’s results to estimate the variances and Relative ME for all ffteen quality attributes for future Harvest and Export Cargo Quality Reports. In future years, we will adjust our sampling protocol accordingly to increase our sampling accuracy and to obtain a Relative ME of ± 10% or less for all ffteen quality factors.
The sampling proportions of 67.9%, 21.6% and 10.5% for the Gulf, Pacific Northwest and Southern Rail ECAs, respectively, and a total sample size of 384 would allow us to estimate the true averages of the four quality characteristics with our desired level of precision for the U.S. Aggregate and for the three ECAs with one exception. The one exception was total damage in the Southern Rail ECA because the ECA’s sample size would be only 40. Therefore, it was decided to collect an additional 10 samples in the Southern Rail ECA to have sufficient samples for estimating total damage with a Relative ME of less than ± 10%. Despite the additional 10 samples collected from the Southern Rail ECA, the U.S. Aggregate averages would be weighted by the original sampling proportions.
Sampling
Since corn samples for interior rail shipments are not collected and inspected by FGIS, but by any of several officially designated agencies, FGIS does not have direct access to their samples or inspection data. These issues created logistical challenges that made it infeasible to collect samples from the interior rail shipments for the Export Cargo Quality Report. Upon consultation with FGIS personnel and industry participants familiar with the flow of grain exiting the south-central part of the U.S., it was determined that a reasonable proxy for Southern Rail samples would be seabound shipments collected through the FGIS League City Field Office. In theory, the corn exiting by rail and by ship through Texas has similar, if not the same, origination. Therefore, samples collected through the GIPSA League City Field Office (and specifically, the port of Galveston), were collected to represent the Southern Rail ECA.
The sampling was administered by FGIS as part of their inspection services. Instruction letters were sent to field offices by FGIS on January 30, 2012, and the sampling period began February 6, 2012. The FGIS field offices in the respective ECAs responsible for overseeing the sample collection within their region were as follows: Gulf – New Orleans, Louisiana; Pacific Northwest – Olympia, Washington (Washington State Department of Agriculture); and Southern Rail – League City, Texas.
Representative sublot samples from the ports were collected as ships were loaded, and only lots for which quantitative aflatoxin testing was being performed were to be sampled. (However, some samples were provided on which qualitative aflatoxin tests were performed as required by the export contract.) Samples for grading are obtained by a diverter sampling device approved by FGIS. The diverter sampler “cuts” (or diverts) a representative portion at periodic intervals from a running stream of corn. A cut occurs every few seconds, or about every 500 bushels (about 12.7 MT) as the grain is being assembled for export. The frequency is regulated by an electric timer controlled by official inspection personnel, who periodically determine that the mechanical sampler is functioning properly.
While the sampling process is continuous throughout loading, a shipment or “lot” of corn is divided into “sublots” for the purpose of determining uniformity of quality. Sublot size is based on the hourly loading rate of the elevator and the capacity of the vessel being loaded. Sublot sizes range from 60,000 to 100,000 bushels. All samples are inspected to ensure the entire shipment is uniform in quality.
The frequency of the sampling of the sublots was determined by the desired length of the sampling period. The original goal was to have a four-week sampling period. Based on a five-year average of exports from these ECAs, it was concluded that the targeted number of samples could be collected from each ECA within four weeks by collecting samples from sublots ending in the numbers 3 and 7. However, it became evident after two weeks into the sampling period that exports from all three ECAs were less frequent than projected. As a result, sampling frequency was doubled for all three ECAs, effective March 1, 2012. Sublots ending in 0, 3, 5 and 7 were sampled from that point forward.
A minimum of 2,700 grams was collected by the FGIS field staff and the Washington State Department of Agriculture, congregated at the field offices, and mailed to Illinois Crop Improvement Association Identity Preserved Grain Laboratory (IPGL). Upon arrival at IPGL, the samples were divided for use at IPGL and Champaign-Danville Grain Inspection (CDGI), a FGIS-designated official inspection agency.
The sampling period ended March 6, 2012, for the Pacific Northwest ECA and March 17, 2012, for the Gulf ECA when the targeted number of samples per ECA was reached. As of March 28, 2012, no additional shipments from which samples could be collected were expected from the League City region in the near future. Therefore, in order to publish the Export Cargo Quality Report in a timely manner, the sampling period for the Southern Rail ECA concluded March 28, 2012.