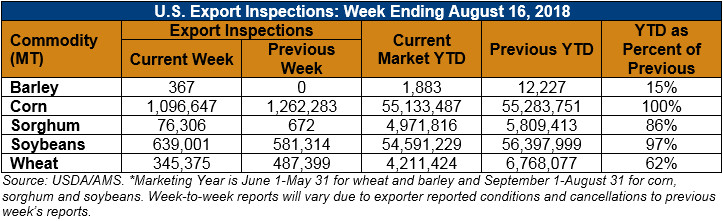
U.S. Export Statistics
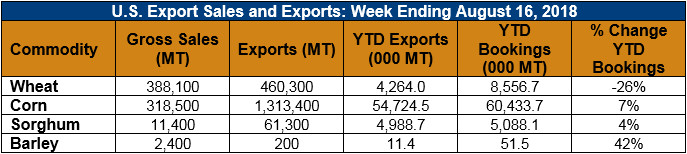
Corn: Net sales of 173,400 MT for 2017/2018 were down 49 percent from the previous week and 55 percent from the prior 4-week average. Increases were reported for Japan (131,000 MT), Mexico (100,400 MT, including decreases of 3,600 MT), Colombia (78,000 MT, including 80,000 MT switched from unknown destinations and decreases of 53,300 MT), Indonesia (73,500 MT, including 68,000 MT switched from unknown destinations), and Saudi Arabia (70,500 MT, including 65,000 MT switched from unknown destinations). Reductions were primarily for unknown destinations (476,100 MT) and El Salvador (15,000 MT). For 2018/2019, net sales of 1,054,600 MT were reported for unknown destinations (403,700 MT), Mexico (280,200 MT), and Egypt (110,000 MT). Exports of 1,313,400 MT were up 8 percent from the previous week, but down 5 percent from the prior 4-week average. The destinations were primarily to Japan (363,600 MT), Mexico (273,600 MT), Colombia (145,200 MT), Taiwan (90,600 MT), and Indonesia (73,500 MT, all late reporting).
Optional Origin Sales: For 2018/2019, the current outstanding balance of 965,000 MT is for unknown destinations (298,000 MT), South Korea (412,000 MT), Vietnam (130,000 MT), Saudi Arabia (70,000 MT), and Malaysia (55,000 MT).
Barley: Net sales of 2,400 MT for 2018/2019 were for Japan (2,000 MT) and Vietnam (400 MT). Exports of 200 MT were to Japan.
Sorghum: Net sales of 11,400 MT for 2017/2018 were for China (57,200 MT, including 52,000 MT switched from unknown destinations), Mexico (5,100 MT), and Burma (1,100 MT). Reductions were reported for unknown destinations (52,000 MT). Exports of 61,300 MT were primarily to China (58,300 MT) and Mexico (3,000 MT).