Chicago Board of Trade Market News
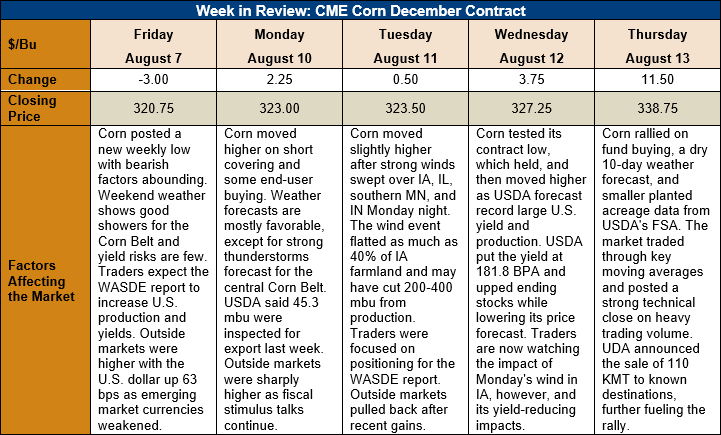
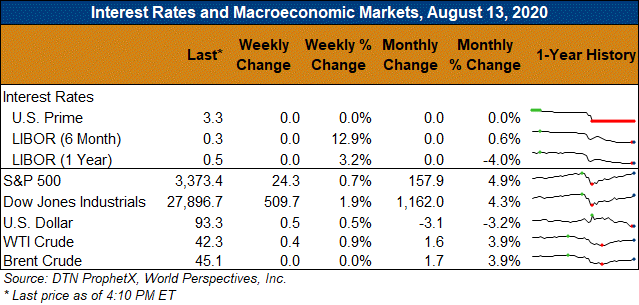
Outlook: December corn futures are up 18 cents (5.6 percent) this week after widespread fund buying emerged following the August WASDE report. While the WASDE confirmed record large U.S. corn yields and large ending stocks, key technical support held firm following the report’s release, triggering technical buying and short covering. Additionally, USDA’s daily export sale for Thursday, August 13, 2020 noted that 110,000 MT of corn was sold to unknown destinations for 2020/21. The indication of strengthening international demand further fueled the rally.
The August WASDE saw USDA project an U.S. average corn yield of 11.417 MT/ha (181.8 bushels/acre) – a new record high. Production for the 2020/21 crop year was pegged at 388.08 MMT (15.278 billion bushels) and total supplies were forecast up 10 percent from 2019/20. Notably, USDA increased its export forecast substantially to 56.518 MMT (2.225 billion bushels) and increased feed and residual use as well. USDA increased its estimate of 2020/21 ending stocks to 70.006 MMT (2.756 billion bushels), which was slightly below the average pre-report estimate. UDSA lowered its forecast of 2020/21 farm prices to $3.10/bushel.
Internationally, USDA increased world corn production for 2020/21 by 7.8 MMT to 1,171 MMT and increased ending stocks for the same marketing year by 2.4 MMT to 317.4 MMT. The world ending stocks-to-use ratio is now estimated at 23.6 percent, down from 24.1 percent in 2019/20. Other notable international changes in the WASDE were the 0.5-MMT upward revision in Ukraine’s corn production and the 2-MMT increase to the EU corn import forecast (now pegged at 25 MMT).
Beyond the corn market, USDA increased its yield estimate for the 2020/21 U.S. sorghum crop to 4.81 MT/ha (76.6 bushels/acre). U.S. sorghum production was increased 1.18 MMT (44 million bushels) and exports were revised 1.016 MMT (40 million bushels) higher as well. U.S. sorghum ending stocks for 2020/21 were increased 25,000 MT (4 million bushels) and the average farm price was lowered to $3.10/bushel.
While the WASDE confirmed large U.S. production and supplies, there are factors suggesting future estimates may decline. The first is the “derecho” weather event that brought 100 MPH winds to parts of Iowa, Minnesota, Illinois, and Indiana. The wind flattened corn fields and some estimates suggest nearly 40 percent of Iowa farmland was affected. The event was not factored into USDA’s August WASDE as it occurred after the survey period ended. Private firms estimate the wind may have lowered U.S. corn production by 5-10 MMT (200-400 million bushels). The impacts of this weather event will be included in the September WASDE.
Another bullish factor is the release of planting and prevent planting data from USDA Farm Service Agency (FSA). The USDA FSA announced that 3.63 million hectares (8.99 million acres) were enrolled in the agency’s Prevent Plant option. The FSA estimated that 81.1 million acres were planted to corn this year, below expectations. The new data suggest USDA is likely to lower its estimate of U.S. corn planted area in the September or October WASDE. USDA creates its acreage estimate based on factors including but limited to the FSA data, so just how much area could be cut remains unclear.
The weekly Export Sales report featured net old-crop corn sales of 377,200 MT and net new-crop sales of 0.553 MMT. Weekly exports were up 95 percent from the prior week at 1.333 MMT and were sufficient to put 2019/20 YTD bookings at 44.159 MMT – down 12 percent from the prior year and in-line with USDA’s forecast.
From a technical standpoint, December futures posted a strongly bullish rally after the August WASDE. The market’s initial reaction was to selloff to the contract low ($3.20), where it found solid support and aggressive commercial buying and short covering. The market posted a strong technical close on Wednesday that, when combined with the FSA data, created a sharp move higher on Thursday. Thursday’s rally broke above the 100-day MA – a bullish signal – but could not sustain a close above that point. The next upside target is an open chart gap at $3.43 ¾ and then psychological resistance at $3.50 above that.