

Did you know the U.S. Grains Council (USGC) has a variety of multimedia resources available to the public on grains.org?
The Council continually develops new visual and audio resources for its members, customers and others to use in sharing the story of how important export demand and trade is to agricultural profitability. This content visually complements the market data that showcases the Council’s mission of developing markets, enabling trade and improving lives.
Recent additions to the Council’s multimedia resources include:
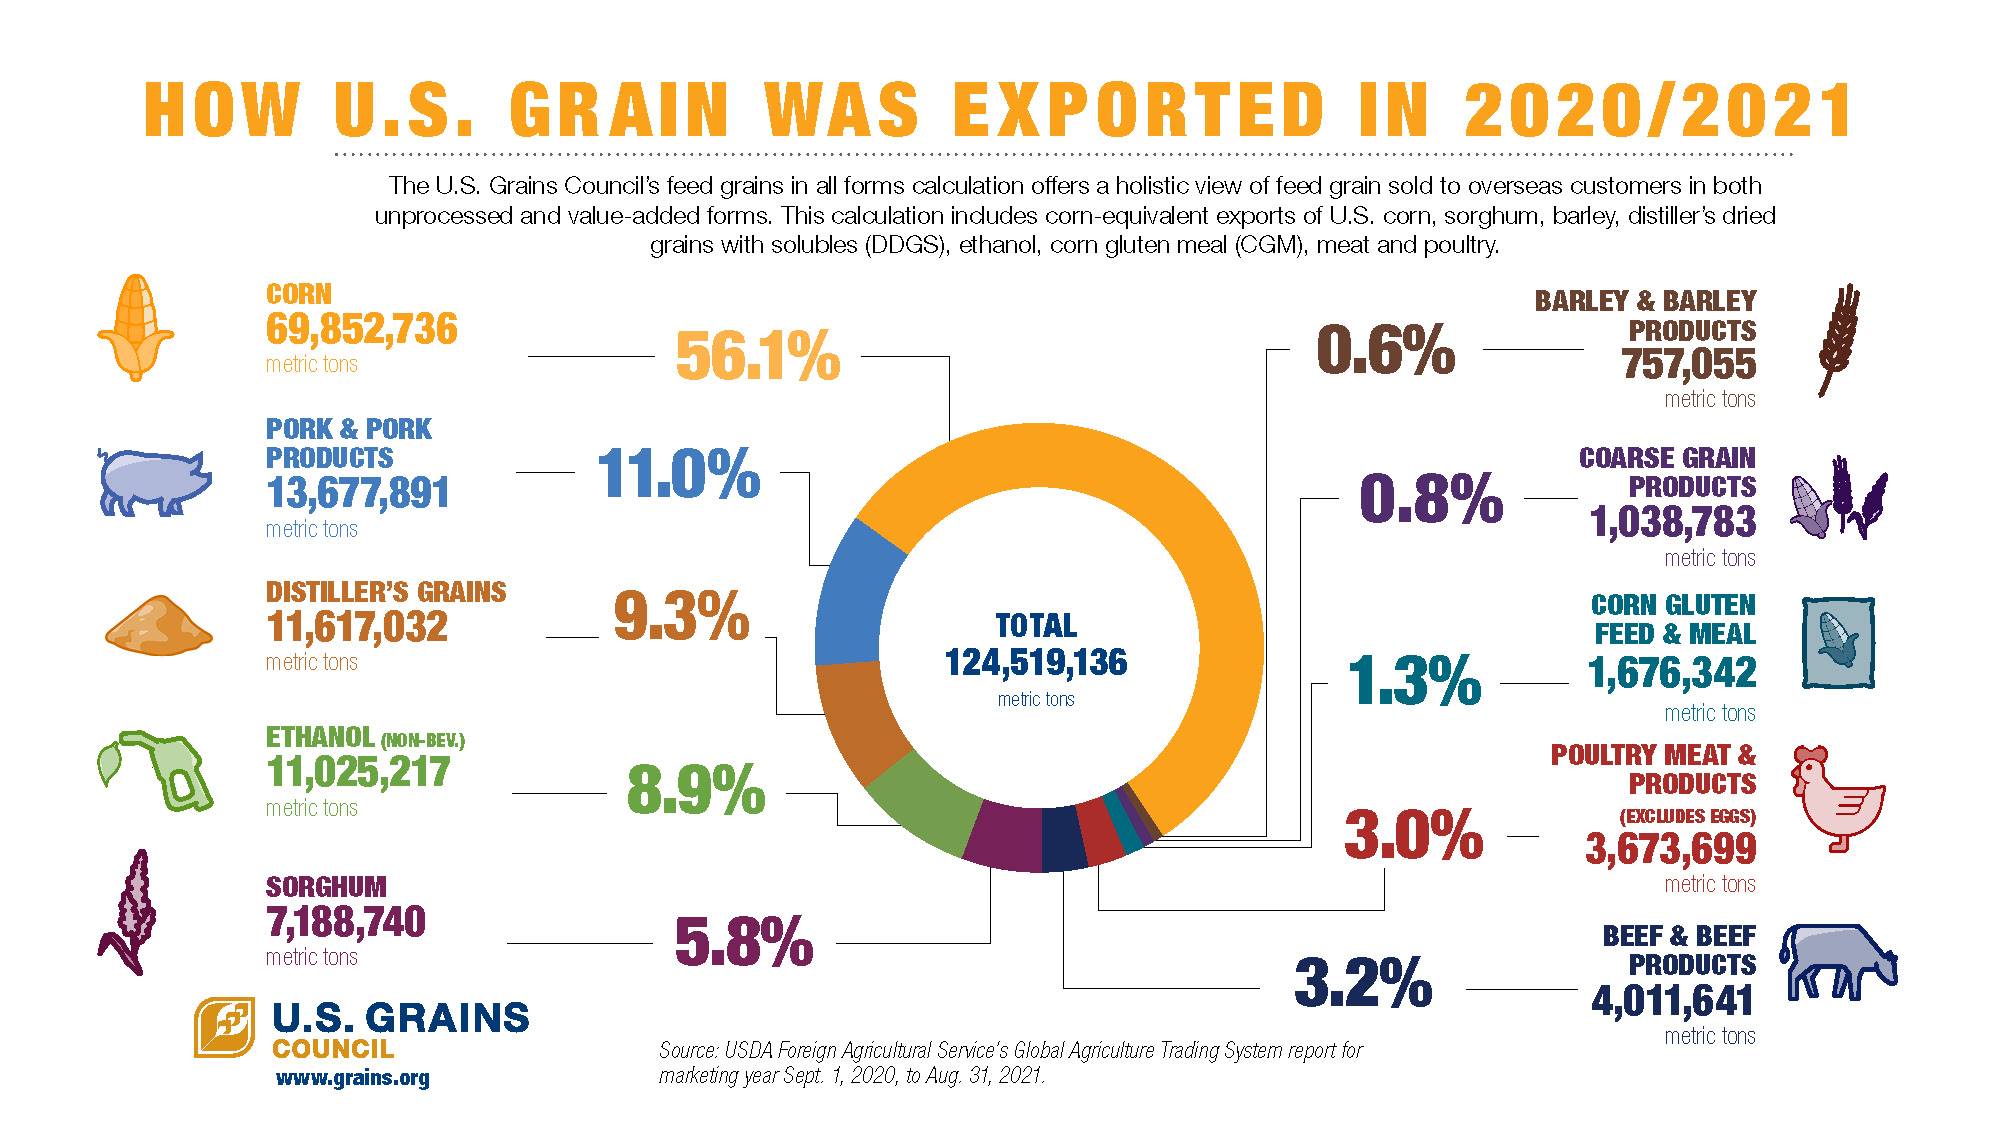
– How Grain Was Exported in 2020/2021, provides an overview of how feed grain was sold overseas in unprocessed and value-added forms.
– U.S. Ethanol Promotion Around the Globe, a visual explanation of the main markets for ethanol promotion.
– Where Are U.S. Grains In All Forms (GIAF) Going?, a breakdown of where GIAF were exported the most in the 2020/2021 marketing year by quantity and value.
– Where Is U.S. Corn Going?, a breakdown of the top U.S. corn export customers in the 2020/2021 marketing year by quantity and value.
–Where Is U.S. Sorghum Going?, a breakdown of the top U.S. sorghum export customers in the 2020/2021 marketing year by quantity and value.
–Where Is U.S. Barley Going?, a breakdown of the top U.S. barley export customers in the 2020/2021 marketing year by quantity and value.
–Where Is U.S. Ethanol Going?, a breakdown of the top U.S. ethanol export customers in the 2020/2021 marketing year by quantity and value.
–Where Is U.S. DDGS Going?, a breakdown of the top U.S. distiller’s dried grains with solubles (DDGS) export customers in the 2020/2021 marketing year by quantity and value.
The downloadable infographics, many of which the Council updates annually, provide readers with images to complement the numbers they represent and help explain the work the Council does – from How Does U.S. Grain Move? to a global map of USGC’s presence.
About The U.S. Grains Council
The U.S. Grains Council develops export markets for U.S. barley, corn, sorghum and related products including distiller’s dried grains with solubles (DDGS) and ethanol. With full-time presence in 28 locations, the Council operates programs in more than 50 countries and the European Union. The Council believes exports are vital to global economic development and to U.S. agriculture’s profitability. Detailed information about the Council and its programs is online at www.grains.org.