
C. Chemical Composition
The chemical composition of corn consists primarily of protein, starch and oil. While these attributes are not graded factors, they are of significant interest to end users. Chemical composition values provide additional information related to nutritional value for livestock and poultry feeding, for wet milling uses and other processing uses of corn. Unlike many physical attributes, chemical composition values are not expected to change significantly during storage or transit.
SUMMARY: CHEMICAL COMPOSITION
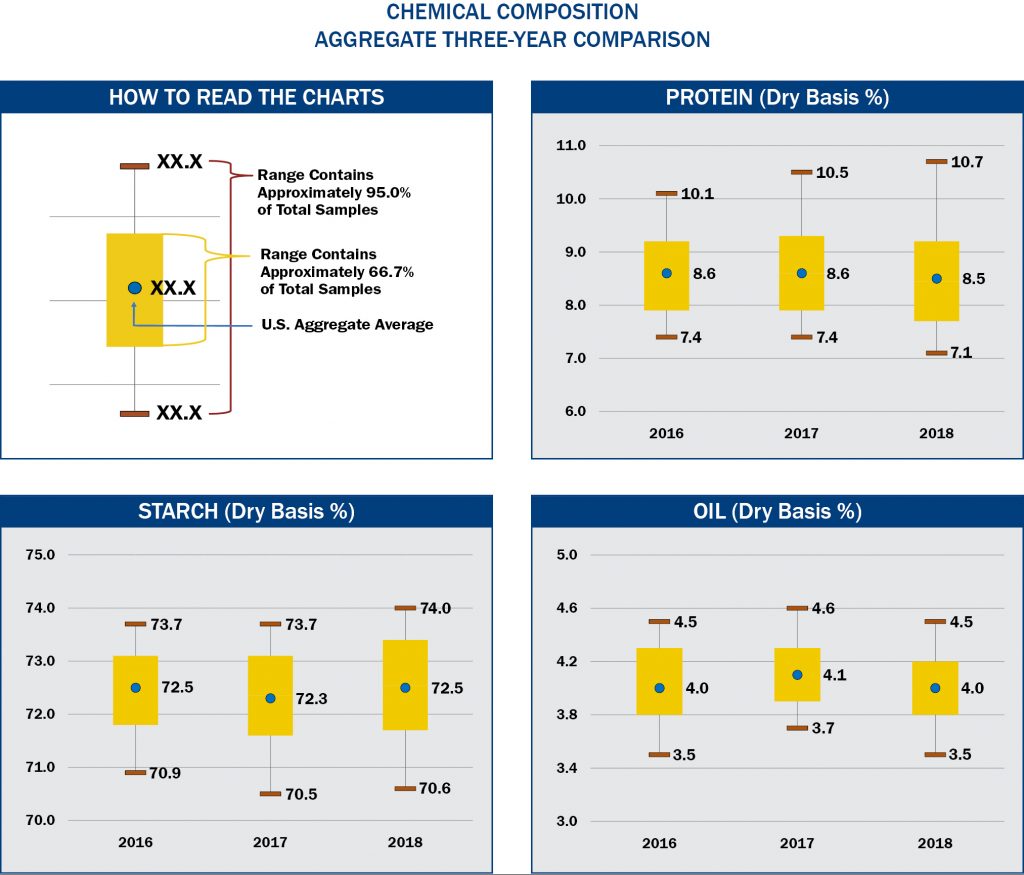
- Average U.S. Aggregate protein concentration in 2018 (8.5% dry basis) was lower than in 2017 and 2016 (both 8.6%), but the same as the 5YA (8.5%).
- The Gulf ECA had lower protein concentrations than the other ECAs in 2018, 2017, 2016 and the 5YA.
- Average U.S. Aggregate starch concentration in 2018 (72.5% dry basis) was similar to 2017 and 2016 but, lower than the 5YA (73.1%).
- The Gulf ECA had higher starch concentrations than the Pacific Northwest and Southern Rail ECAs in 2018, 2017, 2016 and the 5YA.
- Average U.S. Aggregate oil concentration in 2018 (4.0% dry basis) was lower than in 2017 (4.1%), the same as 2016 (4.0%) and higher than the 5YA (3.9%).
- The variability in chemical concentrations was similar for 2018, 2017 and 2016, based on similar standard deviations for protein, starch and oil.
- Oil concentration averages for Gulf, Pacific Northwest and Southern Rail ECAs were all 4.0%. Oil concentrations averages have varied by 0.1% or less among the ECAs for 2018, 2017, 2016 and the 5YA.
1. Protein
Protein is very important for poultry and livestock feeding because it supplies essential sulfur-containing amino acids and helps to improve feed conversion efficiency. Protein concentration tends to decrease with decreased available soil nitrogen and in years with high yields. Protein is usually inversely related to starch concentration. Results are reported on a dry basis.
RESULTS
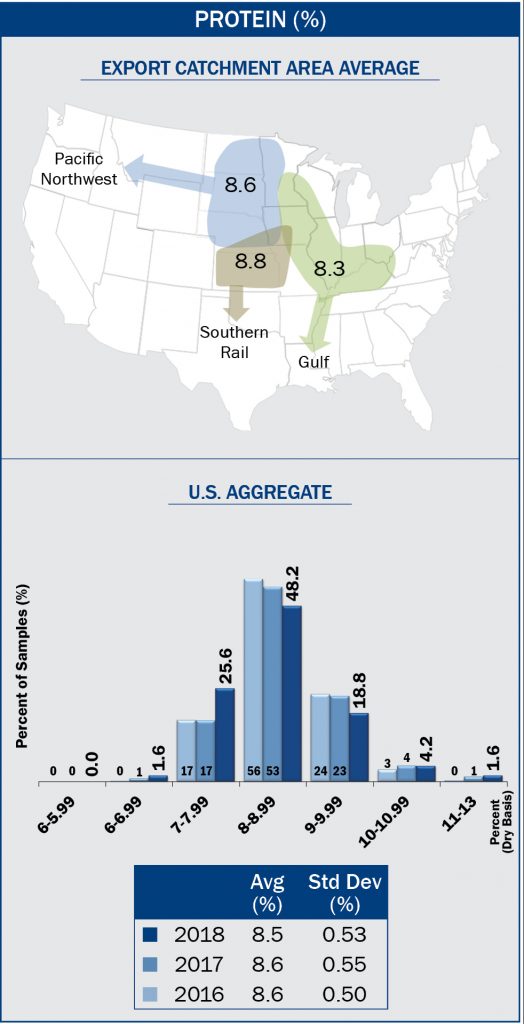
- Average U.S. Aggregate protein concentration in 2018 averaged 8.5%, lower than 2017 and 2016 (both 8.6%), but the same as the 5YA (8.5%).
- Average U.S. Aggregate protein standard deviation in 2018 (0.53%) was similar to 2017 (0.55%), 2016 (0.50%) and the 5YA (0.56%).
- The range in protein concentration in 2018 (6.6% to 11.9%) was similar to ranges in 2017 (6.4% to 12.2%) and 2016 (6.8% to 11.7%).
- Protein concentrations in 2018 were distributed with 27.2% below 8.0%, 48.2% between 8.0% and 8.99% and 24.6% above 9.0%. The protein distribution in 2018 shows a higher number of low protein samples than in 2017 and 2016.
- Protein concentration averages for Gulf, Pacific Northwest and Southern Rail ECAs were 8.3%, 8.6% and 8.8%, respectively. The Gulf ECA had the lowest protein for 2018, 2017, 2016 and the 5YA.
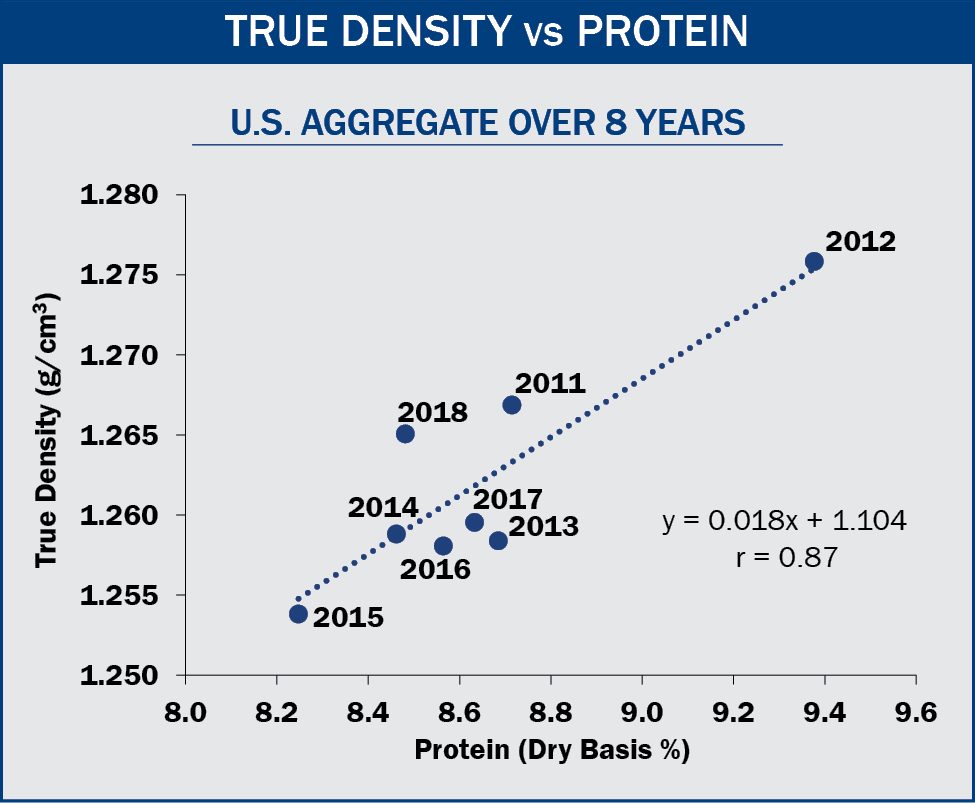
- Based on U.S. Aggregate averages over the past eight years, as protein concentration increases, true density also increases (resulting in a correlation coefficient of 0.87), as shown in the figure to the right. In general, protein concentration appears to be lower in years with lower true density and higher in years with higher true density.
2. Starch
Starch is an important factor for corn used by wet millers and dry-grind ethanol manufacturers. High starch concentration is often indicative of good kernel growing/filling conditions and reasonably moderate kernel densities. Starch is usually inversely related to protein concentration. Results are reported on a dry basis.
RESULTS
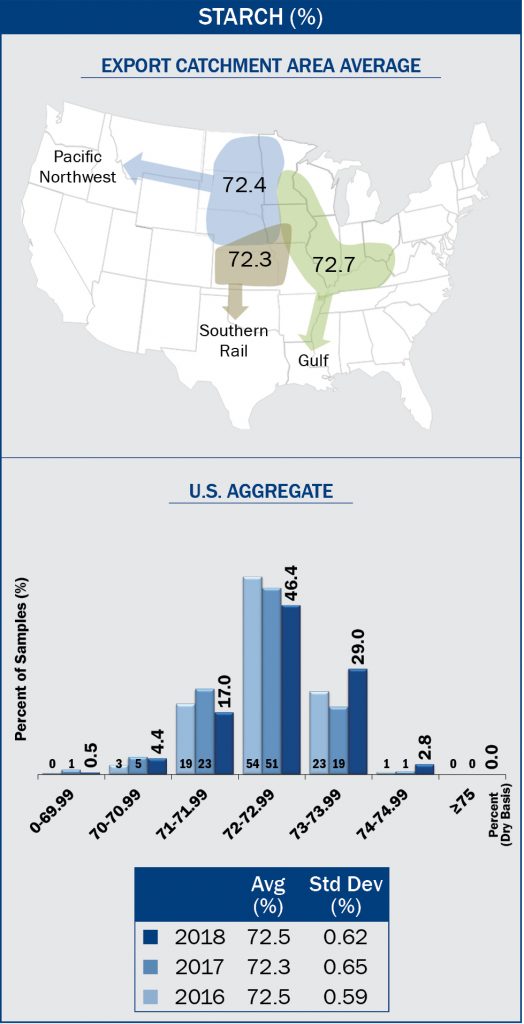
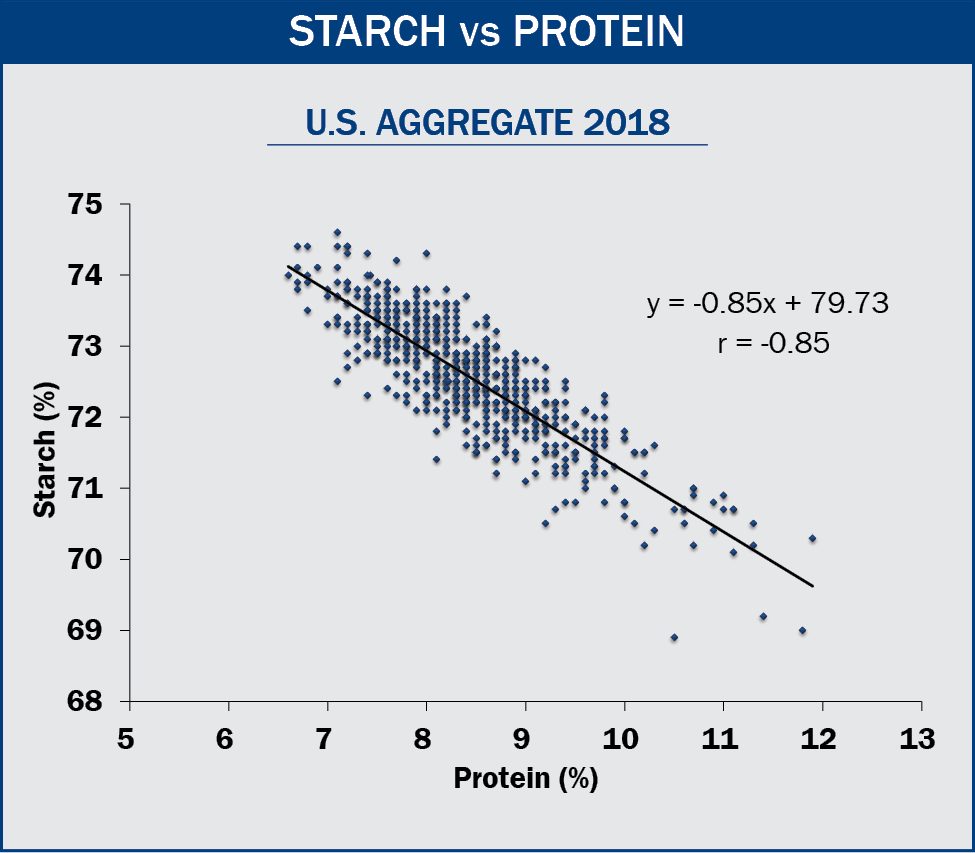
- Average U.S. Aggregate starch concentration in 2018 (72.5%) was similar to 2017 (72.3%) and 2016 (72.5%), but lower than the 5YA (73.1%).
- U.S. Aggregate starch standard deviation in 2018 (0.62%) was similar to 2017 (0.65%), 2016 (0.59%) and the 5YA (0.63%).
- Starch concentration range in 2018 (68.9% to 74.6%) was similar to 2017 (69.0% to 74.2%) and 2016 (69.2% to 74.3%).
- Starch concentrations in 2018 were distributed with 21.9% of the samples below 72.0%, 46.4% between 72.0% and 72.99% and 31.8% at 73.0% and higher. This distribution shows a higher number of samples at starch levels above 73.0% in 2018 than in 2017 and 2016.
- Starch concentration averages for the Gulf, Pacific Northwest and Southern Rail ECAs were 72.7%, 72.4% and 72.3%, respectively. Starch concentration averages were highest in the Gulf ECA in 2018, 2017, 2016 and the 5YA. Thus, the Gulf ECA had the highest starch and lowest protein in 2018, 2017, 2016 and the 5YA.
- Since starch and protein are the two largest components in corn, when the percentage of one goes up, the other usually goes down. This relationship is illustrated in the adjacent figure showing a negative correlation (-0.85) between starch and protein.
3. Oil
Oil is an essential component of poultry and livestock rations. It serves as an energy source, enables fat-soluble vitamins to be utilized and provides certain essential fatty acids. Oil is also an important co-product of corn wet and dry milling. Results are reported on a dry basis.
RESULTS
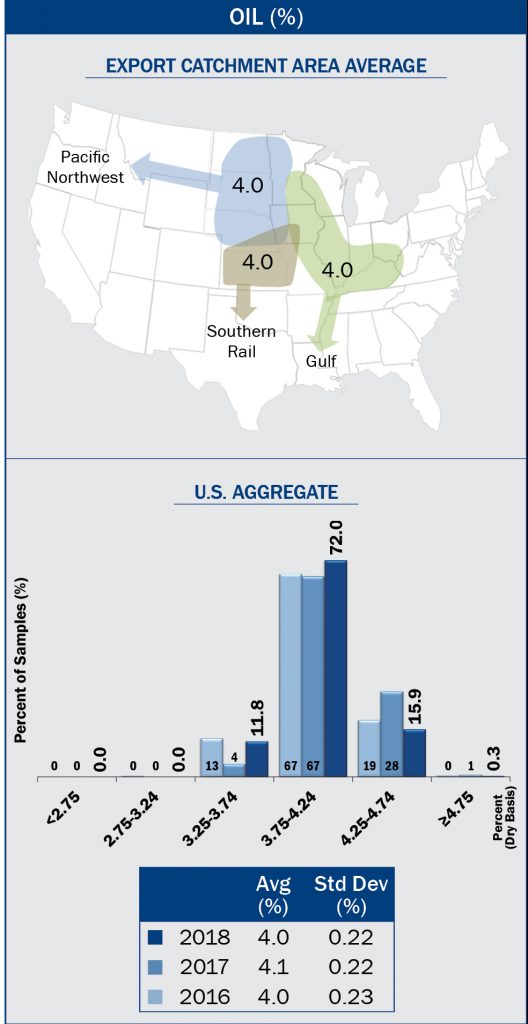
- Average U.S. Aggregate oil concentration in 2018 (4.0%) was lower than in 2017 (4.1%), the same as 2016 (4.0%) and higher than the 5YA (3.9%).
- U.S. Aggregate oil standard deviation in 2018 (0.22%) was the same as 2017, similar to 2016 (0.23%), but lower than the 5YA (0.28%).
- Oil concentration range in 2018 (3.3% to 5.2%) was similar to 2017 (3.3% to 5.5%) and 2016 (3.2% to 4.9%).
- Oil concentrations in 2018 were distributed with 11.8% of the samples at 3.74% or lower, 72.0% of samples at 3.75% to 4.24% and 16.2% at 4.25% and higher. The distribution in 2018 showed a lower number of samples with oil concentrations at 4.25% or higher than in 2017, but the distribution was similar to that in 2016.
- Oil concentration averages for Gulf, Pacific Northwest and Southern Rail ECAs were all 4.0%. Oil concentrations averages have varied by 0.1% or less among the ECAs for 2018, 2017, 2016 and the 5YA.