V. U.S. CORN PRODUCTION, USAGE AND OUTLOOK
A. U.S. Corn Production1
1. U.S. Average Production and Yields
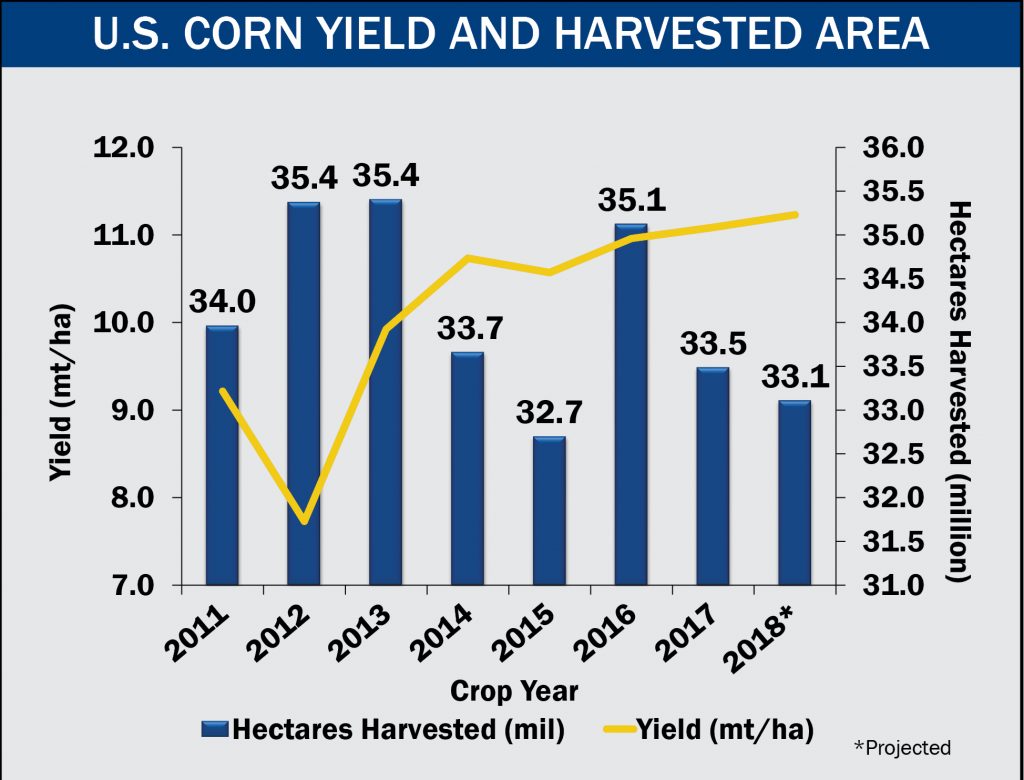
- According to the December 2018 USDA World Agricultural Supply and Demand Estimates (WASDE) report, average U.S. corn yield for the 2018 crop is projected to be 11.23 mt/ha (178.9 bu/ac). This is 0.14 mt/ha (2.3 bu/ac) higher than the average yield for the 2017 corn crop and the highest average yield on record.
- The number of hectares harvested in 2018 is projected to be 33.10 million (81.8 mil ac). This is 0.38 mil ha (0.9 mil ac) less than in 2017 and is slightly less than the average of 33.67 mil ha (83.2 mil ac) harvested from 2008 through 2017.
- While 2018 saw the seventh-highest number of harvested hectares in the past decade, the 2018 crop experienced the highest average yield on record, thereby producing a crop estimated to be the third-largest U.S. corn crop on record at 371.52 mmt (14,626 mil bu). This crop is estimated to be 13.26 mmt (522 mil bu) smaller than 2016’s record crop (384.78 mmt or 15,148 mil bu).
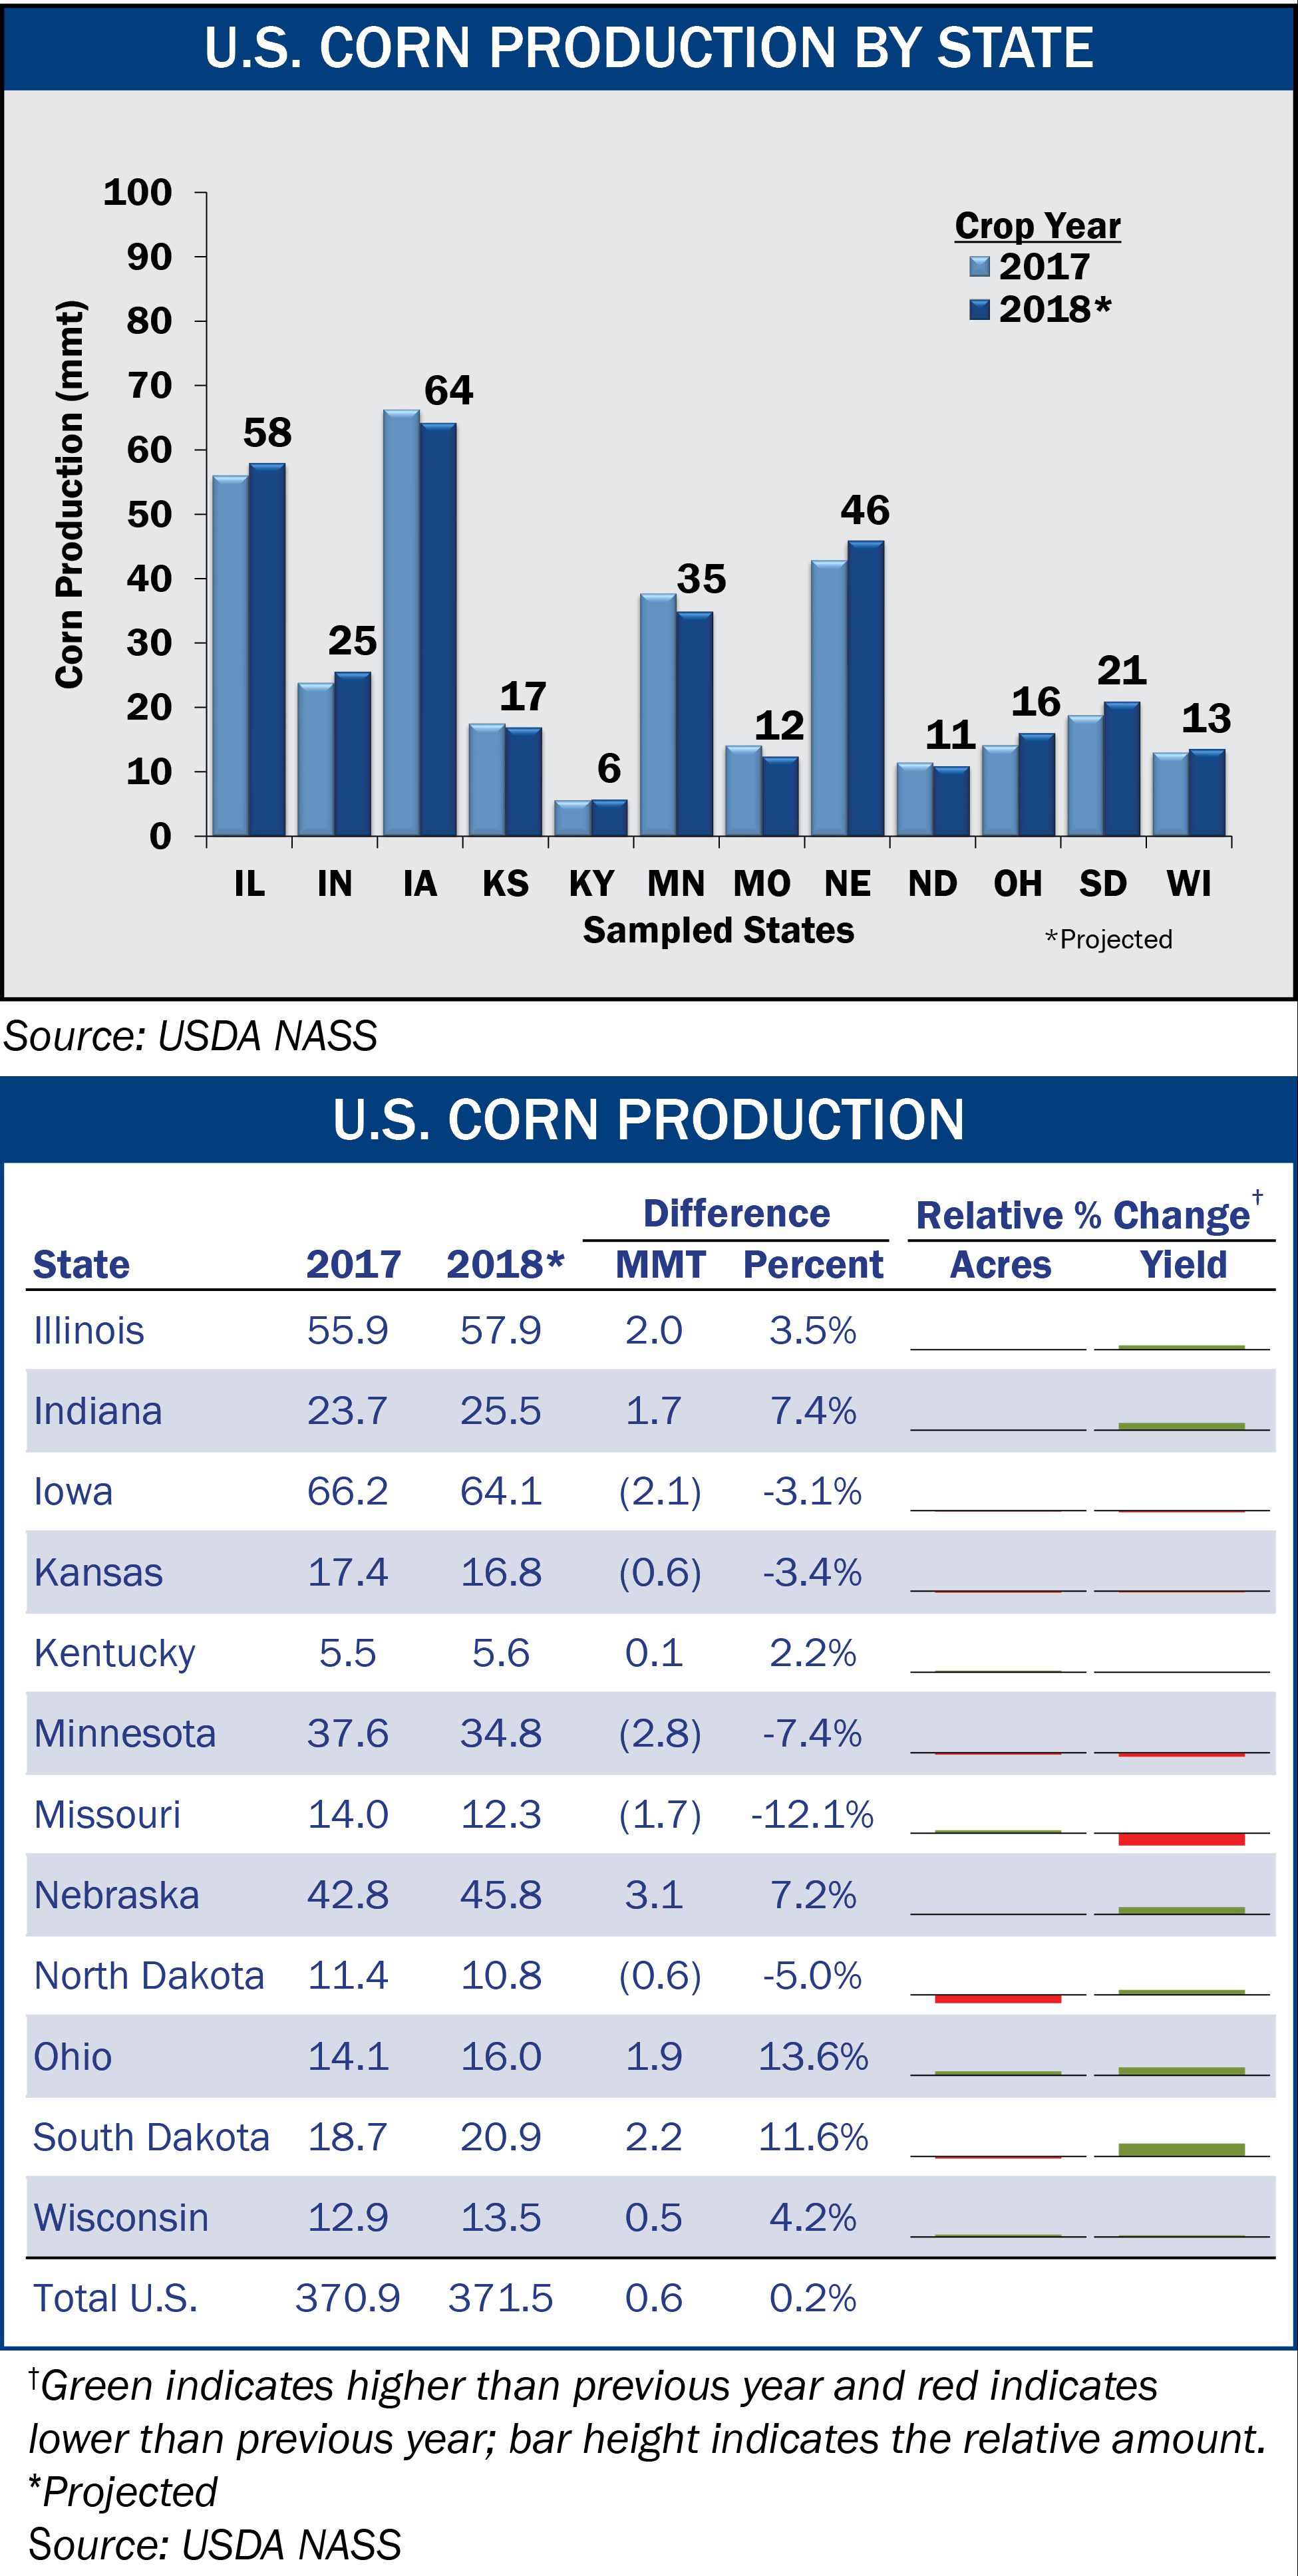
2. ASD and State-Level Production
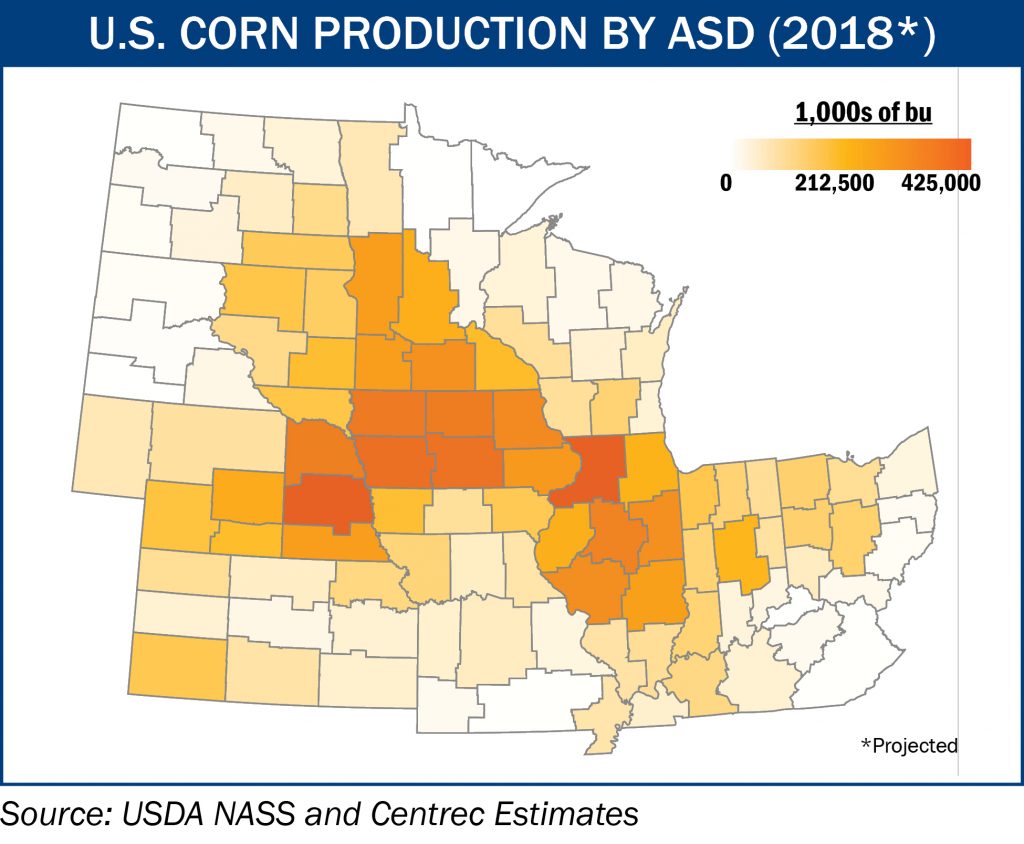
The geographic areas included in the 2018/2019 Corn Harvest Quality Report encompass the highest corn-producing areas in the United States. This can be seen on the map showing projected 2018 corn production by USDA Agricultural Statistical District (ASD). These states represent approximately 95.0% of U.S. corn exports.2
Mostly slight differences in state-level yields and harvested acres were observed between the corn crop produced in 2017 and the 2018 crop. While production decreased or remained the same from 2017 in five of the 12-key corn-producing states, only Missouri experienced decreases in production greater than 10.0% compared to their 2017 crops.
The U.S. Corn Production table summarizes the changes in production between each state’s 2017 and projected 2018 corn crops, including an indication of the relative changes in harvested acres and yield. A green bar indicates a relative increase and a red bar indicates a relative decrease from 2017 to projected 2018. This illustrates that 2018 harvested acres remained similar to 2017 for 11 of the 12 surveyed states. With a projected decrease of 9.6%, only North Dakota saw a change in harvested acres of greater than 5.0% compared to its 2017 crop. State-level average yields were generally higher in 2018 relative to 2017. Out of the eight states expecting higher average yields, South Dakota is expected to have the largest increase in yield relative to its 2017 crop (14.5%). Only four states are projected to see a decline in average yields relative to 2017. Missouri is expected to see its state-level average yield fall by 14.7%, making it the only state projected to see a decline in yield over 5.0%.