VI. SURVEY AND STATISTICAL ANALYSIS METHODS
A. Overview
The key points for the survey design, sampling methodology and statistical analysis for this 2018/2019 Harvest Report are as follows:
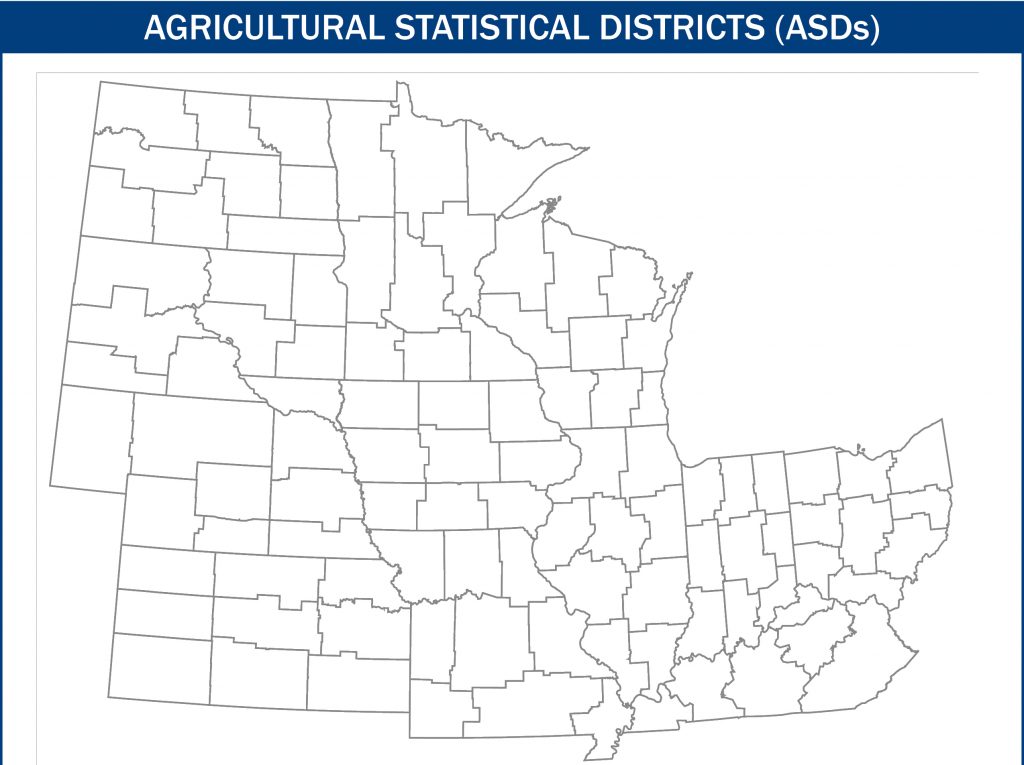
- Following the methodology developed for the previous seven Harvest Reports, the samples were proportionately stratified according to ASDs across 12 key corn-producing states representing approximately 95.0% of U.S. corn exports.
- A total of 608 samples collected from the 12 states was targeted to achieve a maximum ±10.0% relative margin of error (Relative ME)
at the 95.0% confidence level. - A total of 618 unblended corn samples pulled from inbound farm-originated trucks were received from local elevators from August 27 through November 28, 2018.
- A proportionate stratified sampling technique was used for the mycotoxin testing across the ASDs in the 12 states surveyed for the other quality factors. This sampling resulted in 181 samples being tested for aflatoxin and DON.
- Weighted averages and standard deviations following standard statistical techniques for proportionate stratified sampling were calculated for the U.S. Aggregate and the three ECAs.
- To evaluate the statistical validity of the samples, the Relative ME was calculated for each of the quality attributes at the U.S. Aggregate and the three ECA levels. The Relative ME for stress cracks was above ±10.0% for the Gulf, Pacific Northwest and Southern Rail ECAs, while the Relative ME for stress crack index was above ±10.0% for the U.S. Aggregate and across the three ECAs. In addition, total damage in the Pacific Northwest ECA also had a Relative ME above ±10.0%. While the lower level of precision for these quality factors is less than desired, these levels of Relative ME do not invalidate the estimates.
- Two-tailed t-tests at the 95.0% confidence level were calculated to measure statistical differences between the 2018 and 2017 and the 2018 and 2016 quality factor averages.