
Grade Factors
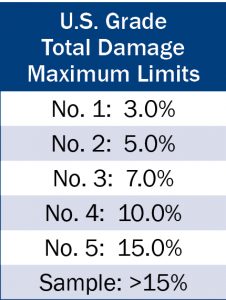
The USDA FGIS has established numerical grades, definitions and standards for measurement of many quality attributes. The attributes that determine the numerical grades for corn are test weight, BCFM, total damage and heat damage. A table displaying the numerical requirements for these attributes is included in the “U.S. Corn Grades and Conversions” section of this report.
Summary: Grade Factors and Moisture
- Average U.S. Aggregate test weight (58.4 lb/bu or 75.1 kg/hl) was the same as 2017 and slightly higher than in 2016 and the 5YA. It was well above the limit for U.S. No. 1 grade corn.
- As in previous years, the average test weight was above the minimum for U.S. No. 1 grade in all ECAs.
- Average U.S. Aggregate BCFM (0.7%) was lower than 2017 and the 5YA (both 0.8%), the same as 2016, and well below the maximum for U.S. No. 1 grade (56 lb/bu).
- BCFM levels in almost all (98.1%) of the corn samples were equal to or below the 3.0% maximum allowed for No. 2 grade.
- Average BCFM differed by no more than 0.1% between all three ECAs.
- Average U.S. Aggregate broken corn (0.5%) was lower than last year and the 5YA, but the same as 2016.
- Average U.S. Aggregate foreign material (0.2%) was same as last year and the 5YA, but higher than 2016.
- Total damage in the U.S. Aggregate samples averaged 1.5% in 2018; higher than in 2017, lower than in 2016 and the 5YA and well below the limit for U.S. No. 1 grade (3.0%). A total of 89.2% of samples contained 3.0% or less damaged kernels.
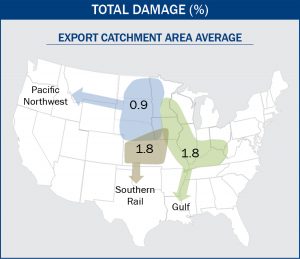
- The Pacific Northwest ECA had the lowest total damage in 2018, 2017, 2016 and the 5YA, while the Gulf ECA had the highest or tied for the highest total damage for 2018, 2017, 2016 and the 5YA. Average total damage values in all ECAs were well below the limit for U.S. No. 1 grade (3.0%).
- No heat damage was reported on any of the samples; the same as 2017, 2016 and the 5YA.
- Average U.S. Aggregate moisture content in 2018 (16.0%) was lower than in 2017 and the 5YA, but similar to 2016.
- The 2018 average moisture contents for the Gulf and Pacific Northwest ECAs (both 16.1%) were higher than the Southern Rail ECA (15.5%). Average moisture levels for the Southern Rail ECA were lowest among all ECAs for 2018, 2017, 2016 and the 5YA. There were fewer high moisture samples in the 2018 crop than in the 2017 and 2016, with 24.7% of the samples containing more than 17.0% moisture, compared to 36% in 2017 and 29% in 2016. This distribution indicates less drying was required in 2018 than in the previous year.
- Even with lower moisture contents in 2018 than in 2017, care should still be taken to monitor and maintain moisture levels sufficiently low to prevent possible mold growth during storage.
![]()
1. Test Weight
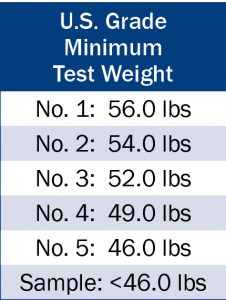
Test weight (weight per volume) is a measure of bulk density and is often used as a general indicator of overall quality and as a gauge of endosperm hardness for alkaline cookers and dry millers. High test weight corn takes up less storage space than the same weight of corn with a lower test weight. Test weight is initially impacted by genetic differences in the structure of the kernel. However, it is also affected by moisture content, method of drying, physical damage to the kernel (broken kernels and scuffed surfaces), foreign material in the sample, kernel size, stress during the growing season and microbiological damage. When sampled and measured at the point of delivery from the farm at a given moisture content, high test weight generally indicates high quality, high percent of horneous (or hard) endosperm and sound, clean corn. Test weight is positively correlated with true density and reflects kernel hardness and good maturation conditions.
RESULTS
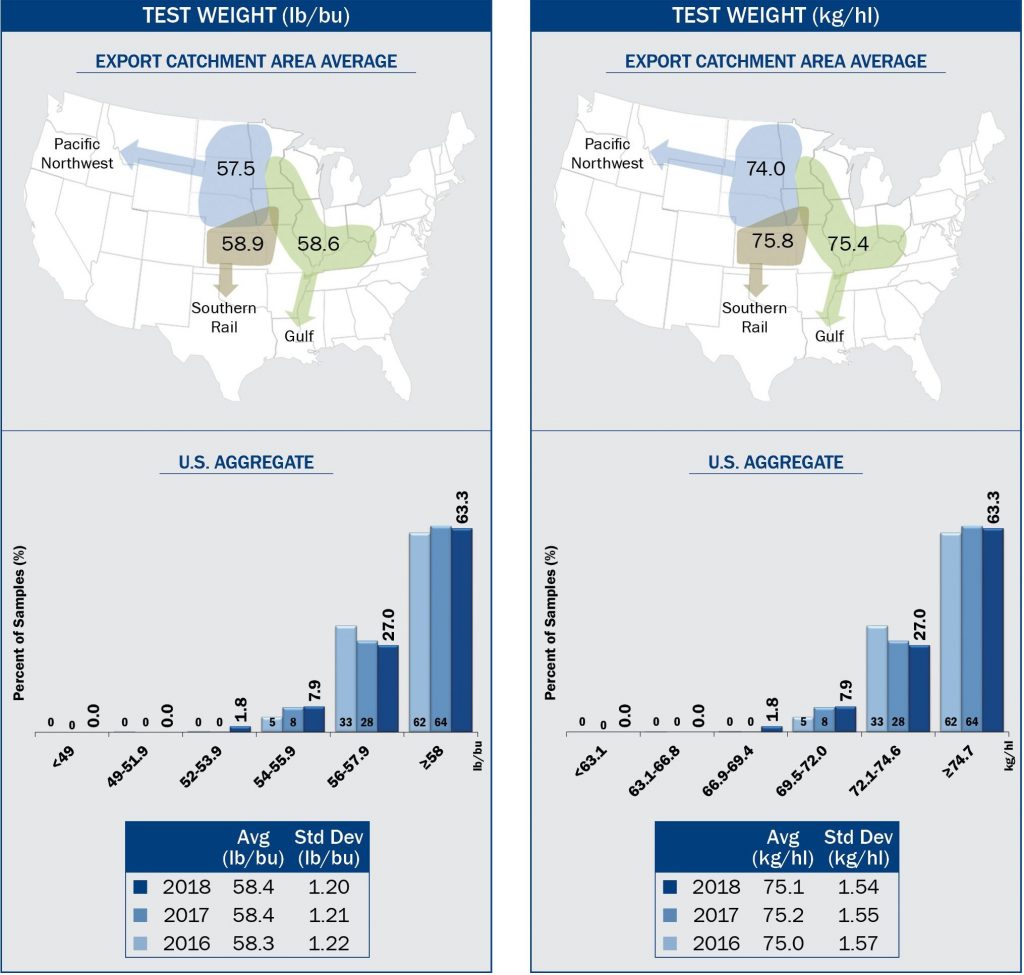
- Average U.S. Aggregate test weight in 2018 (58.4 lb/bu) was the same as 2017 (58.4 lb/bu), but higher than 2016 (58.3 lb/bu) and the 5YA (58.1 lb/bu).
- Average U.S. Aggregate test weight in 2018 was well above the minimum for U.S. No. 1 grade (56.0 lb/bu).
- U.S. Aggregate test weight standard deviation in 2018 (1.20 lb/bu) was similar to 2017 (1.21 lb/bu) and 2016 (1.22 lb/bu), but lower than the 5YA (1.27 lb/bu).
- The range in values among the 2018 harvest samples (52.3 to 62.1 or 9.8 lb/bu) was less than 2017 harvest samples (52.1 to 62.7 lb/bu or 10.6 lb/bu) and 2016 (51.5 to 61.9 lb/bu or 10.4 lb/bu).
- The 2018 test weight values were distributed with 90.3% of the samples at or above the factor limit for U.S. No. 1 grade (56.0 lb/bu). This distribution was similar to 2017 (92%) and 2016 (95%). In 2018, 98.2% of the samples were above the limit for U.S. No. 2 grade (54.0 lb/bu), compared to 100% in 2017 and 2016.
- Average test weight was above the limit for U.S. No. 1 grade in all ECAs. The Gulf (58.6 lb/bu) and Southern Rail (58.9 lb/bu) ECAs had the highest average test weights. The Pacific Northwest ECA (57.5 lb/bu) had the lowest test weight in 2018, 2017, 2016 and the 5YA.
- Besides having the lowest test weight in 2018, the Pacific Northwest ECA had the highest variability, as indicated by its higher standard deviation (1.37 lb/bu), compared to the Gulf (1.13 lb/bu) and Southern Rail (1.19 lb/bu) ECAs.
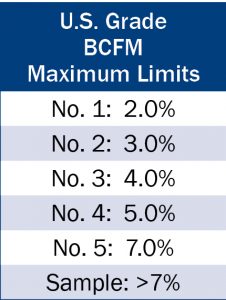
2. Broken Corn and Foreign Material (BCFM)
BCFM is an indicator of the amount of clean, sound corn available for feeding and processing. The lower the percentage of BCFM, the less foreign material and/or fewer broken kernels are in a sample. Higher levels of BCFM in farm-originated samples generally stem from harvesting practices and/or weed seeds in the field. BCFM levels will normally increase during drying and handling, depending on the methods used and the soundness of the kernels.
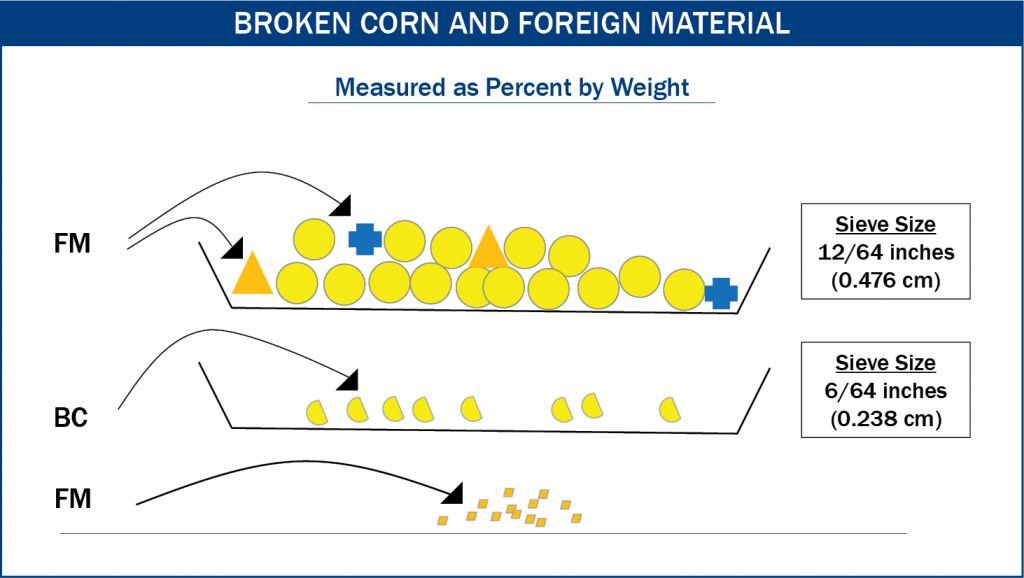
Broken corn (BC) is defined as corn and any other material (such as weed seeds) small enough to pass through a 12/64th-inch round-hole sieve, but too large to pass through a 6/64th-inch round-hole sieve. Foreign material (FM) is defined as any non-corn material too large to pass through a 12/64th-inch round-hole sieve, as well as all fine material small enough to pass through a 6/64th-inch round-hole sieve. The diagram shown below illustrates the measurement of broken corn and foreign material for the U.S. corn grades.
RESULTS
- Average U.S. Aggregate BCFM in 2018 (0.7%) was lower than 2017 (0.8%), same as 2016 (0.7%), below the 5YA (0.8%) and well below the maximum for U.S. No. 1 grade (2.0%).
- The variability of BCFM in the 2018 crop, based on standard deviation (0.51%), was less than 2017 (0.57%) and the 5YA (0.55%), but greater than 2016 (0.45%).
- The range between minimum and maximum BCFM values in 2018 (7.5%) was similar to 2017 (7.3%), but more than 2016 (4.0%). The 2018 samples were distributed with 95.3% of the samples below the maximum BCFM level for U.S. No. 1 grade (2.0%), compared to 95% in 2017 and 97% in 2016. BCFM levels in nearly all samples (98.1%) were equal to or below the maximum 3.0% limit for No. 2 grade.
- Average BCFM for the Gulf, Pacific Northwest and Southern Rail ECAs (0.7%, 0.8% and 0.7%, respectively) differed by 0.1% across the ECAs. The difference in average BCFM across ECAs was 0.0% to 0.1% in 2017, 2016 and the 5YA.
3. Broken Corn
Broken corn in U.S. grades is based on particle size and usually includes a small percent of the non-corn material. Broken corn is more subject to mold and insect damage than whole kernels, and it can cause problems in handling and processing. When not spread or stirred in a storage bin, broken corn tends to stay in the center of the bin, while whole kernels are likely to gravitate outward to the edges. The center area in which broken corn tends to accumulate is known as a “spout-line.” If desired, the spout-line can be reduced by drawing this grain out of the center of the bin.
RESULTS
![]()
- Broken corn in the U.S. Aggregate samples averaged 0.5% in 2018, slightly lower than 2017 and the 5YA (0.6%), and the same as 2016 (0.5%).
- The variability of broken corn for the 2018 crop was similar to previous years and the 5YA, as measured by standard deviations. Standard deviations for 2018, 2017, 2016 and the 5YA were 0.33%, 0.39%, 0.34% and 0.39%, respectively.
- The range in broken corn values in 2018 (3.6%), was between 2017 (3.5%) and 2016 (3.8%).
- The 2018 samples were distributed with 12.6% having 1.0% or more broken corn, compared to 19% in 2017 and 9% in 2016.
- The percentage of broken corn was fairly consistent across the Gulf, Pacific Northwest and Southern Rail ECAs (with averages of 0.5%, 0.6% and 0.5%, respectively).
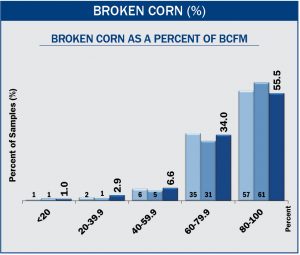
- The distribution chart on the next page, displaying broken corn as a percentage of BCFM, shows that in 55.5% of the samples BCFM consisted of at least 80.0% broken corn. These results were similar to what was found in previous years.
4. Foreign Material
Foreign material is important because it has reduced feeding or processing value. It is also generally higher in moisture content than corn and therefore creates a potential for deterioration of corn quality during storage. Additionally, foreign material contributes to the spout-line (as mentioned in Broken Corn). It also has the potential to create more quality problems than broken corn, due to its higher moisture level.
RESULTS
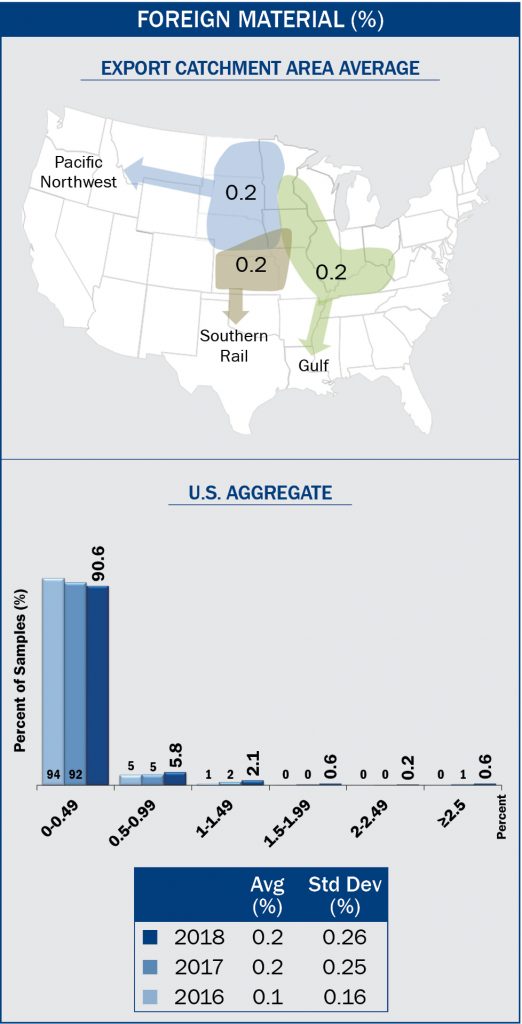
- Foreign material in the U.S. Aggregate samples averaged 0.2% in 2018 and 2017; higher than in 2016 (0.1%), but the same as the 5YA (0.2%). Combines, which are designed to remove most fine material, appear to be functioning well, given the consistently low level of foreign material found across the years.
- Variability, measured by standard deviation, among the U.S. Aggregate samples in 2018 (0.26%) was similar to 2017 (0.25%); higher than in 2016 (0.16%), but nearly the same as the 5YA (0.22%).
- Foreign material in the 2018 samples showed a wider range (0.0% to 7.3%) than samples from 2017 (0.0% to 6.3%) and 2016 (0.0% to 1.6%).
- In the 2018 crop, 90.6% of the samples contained less than 0.5% foreign material, essentially the same as 2017 (92%) and 2016 (94%).
- The percentages of foreign material for the Gulf, Pacific Northwest and Southern Rail ECAs were all 0.2%. All ECAs had average foreign material values of 0.2% in 2018, 2017 and the 5YA. In 2016, all ECAs had average foreign material of 0.1% or 0.2%.
5. Total Damage
Total damage is the percent of kernels and pieces of kernels that are visually damaged in some way, including damage from heat, frost, insects, sprouting, disease, weather, ground, germ and mold. Most of these types of damage result in some sort of discoloration or change in kernel texture. Damage does not include broken pieces of grain that are otherwise normal in appearance.
Mold damage is usually associated with higher moisture contents and warm temperatures during the growing season and/or during storage. There are several field molds, such as Diplodia, Aspergillus, Fusarium and Gibberella, that can lead to mold-damaged kernels during the growing season if the weather conditions are conducive to their development. While some fungi that produce mold damage can also produce mycotoxins, not all fungi produce mycotoxins. Chances of mold decrease as corn is dried and cooled to lower temperatures.
RESULTS
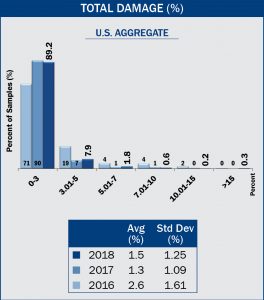
- Average U.S. Aggregate total damage in 2018 (1.5%) was higher than in 2017 (1.3%), lower than 2016 (2.6%), but similar to the 5YA (1.6%). The 2018 total damage average was well below the limit for U.S. No. 1 grade (3.0%).
- Total damage variability in the 2018 crop, as measured by the standard deviation (1.25%), was higher than 2017 (1.09%) and the 5YA (1.19%), but lower than 2016 (1.61%).
- The
 range for total damage in 2018 (0.0% to 19.3%) was higher than in 2017 (0.0% to 13.6%), and lower than in 2016 (0.0% to 23.1%).
- Total damage in the 2018 samples was distributed with 89.2% of the samples having 3.0% or less and 97.1% having 5.0% or less damaged kernels, compared to 2017 with 90% and 97%, and 2016 with 71% and 90%, respectively.
6. Heat Damage
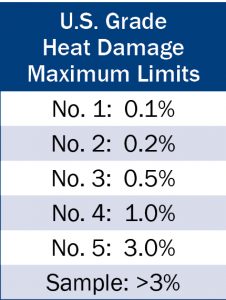
Heat damage is a subset of total damage and has separate allowances in the U.S. Grade standards. Heat damage can be caused by microbiological activity in warm, moist grain or by high heat applied during drying. Heat damage is seldom present in corn delivered directly from farms at harvest.
RESULTS
- There was no heat damage reported in any of the 2018 samples; the same results as 2017, 2016 and the 5YA.
- The absence of heat damage likely was due in part to fresh samples coming directly from farm to elevator with minimal artificial drying.