
II. Introduction
The U.S. Grains Council 2018/2019 Corn Harvest Quality Report has been designed to help international buyers of U.S. corn understand the initial quality of U.S. yellow corn as it enters the merchandising channel. This is the eighth annual measurement survey of the quality of the U.S. corn crop at harvest. Eight years of results are showing patterns in the impact of weather and growing conditions on the quality of U.S. corn as it comes out of the field.
An unseasonably-cold April 2018 in most of the United States was followed by warm, favorable conditions for planting in May. Planting and emergence were initially delayed by these conditions, but crop progress soon reached levels similar to the 5YA by mid-May. Warm, wet weather during the vegetative stage encouraged rapid growth and healthy-looking plants, producing a crop with a combined good-to-excellent condition rating that remained at or above 67% all season and is projected to have the highest average yield on record.
This year’s fast crop maturation allowed for rapid harvest progress in many regions of the country, signified by harvest progress remaining well above the 5YA throughout September. However, abundant rains hindered harvest in October, and progress regressed back to the 5YA.
Overall, the growing conditions in 2018 resulted in a crop with high test weight averages and kernels that were both relatively large and dense. BCFM, stress cracks and whole kernels were also below or close to the 5YA.
These observations show quality differences among the eight years, but overall, the 2018/2019 Harvest Report indicates good quality corn entering the market channel. Overall, 77.3% of the samples met all grade factor requirements for No. 1 grade, and 93.9% met the grade factor requirements for No. 2 grade. In addition, total damage and moisture levels were each slightly lower than the 5YA, which should be good for storability.
Eight years of data have laid the foundation for evaluating trends and the factors that impact corn quality. In addition, the cumulative Harvest Report measurement surveys enable export buyers to make year-to-year comparisons and assess patterns of corn quality based on crop growing conditions across the years.
This 2018/2019 Harvest Report is based on 618 yellow corn samples taken from defined areas within 12 of the top corn-producing and exporting states. Inbound samples were collected from local grain elevators to measure and analyze quality at the point of origin and to provide representative information about the variability of the quality characteristics across the diverse geographic regions.
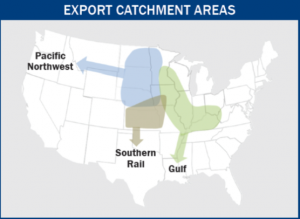
The sampling areas in the 12 states are divided into three general groupings that are labeled Export Catchment Areas (ECAs). These three ECAs are identified by the three major pathways to export markets:
– The Gulf ECA consists of areas that typically export corn through U.S. Gulf ports;
-The Pacific Northwest ECA includes areas exporting corn through Washington, Oregon and California ports; and
-The Southern Rail ECA comprises areas generally exporting corn to Mexico by rail from inland subterminals.
Sample test results are reported at the U.S. Aggregate level and for each of the three ECAs, providing a general perspective on the geographic variability of U.S. corn quality.
The quality characteristics of the corn identified at harvest establish the foundation for the quality of the grain ultimately arriving at the export customers’ doors. However, as corn passes through the U.S. marketing system, it is mingled with corn from other locations; aggregated into trucks, barges and railcars; and stored, loaded and unloaded several times. Therefore, the quality and condition of the corn change between the initial market entry and the export elevator. For this reason, the 2018/2019 Harvest Report should be considered carefully in tandem with the Council’s 2018/2019 Corn Export Cargo Quality Report that will follow early in 2019. As always, the quality of an export cargo of corn is established by the contract between buyer and seller, and buyers are free to negotiate any quality factor that is important to them.
This report provides detailed information on each of the quality factors tested, including averages and standard deviations for the aggregate of all samples, and the samples from each of the three ECAs. The “Quality Test Results” section summarizes the following quality factors:
-Grade Factors: test weight, BCFM, total damage and heat damage
Moisture
-Chemical Composition: protein, starch and oil concentrations
-Physical Factors: stress cracks, stress crack index, 100-kernel weight, kernel volume, kernel true density, whole kernels and horneous (hard) endosperm
-Mycotoxins: aflatoxin and DON
In addition, this Harvest Report includes brief descriptions of the U.S. crop and weather conditions; U.S. corn production, usage and outlook; detailed descriptions of survey, statistical analysis and testing analysis methods; and a new historical perspective section displaying the average of each quality factor from all eight reports.