B. MOISTURE
Moisture content is reported on all official grade certificates, but does not determine which numerical grade will be assigned to the sample. Moisture content is usually specified in the contract by the buyer, independent of the grade. Moisture content is important because it affects the amount of dry matter being sold and purchased. In addition, the average moisture content and variability in a shipment of corn affects its quality upon arrival at the destination. In order to maintain good quality, recommendations for clean corn are as follows: 14% maximum moisture content under aerated storage in U.S. corn-belt conditions for storage no more than six to twelve months, and 13% or less moisture content for storage of more than one year.1
Corn is typically transported in railcars or in closed, nearly airtight holds during ocean voyages. Few bulk carriers or railcars have the ability to aerate the grain mass during transit. This lack of aeration can create an ideal environment for pockets of high moisture to initiate microbiological activity. In addition, temperature variations in the grain mass can cause moisture migration, resulting in warm, moist air condensing on colder surfaces of grain, near sidewalls, or on the underside of hatch covers, which can lead to the development of spoilage or hot spots. Hot spots are small pockets of grain where the moisture content and temperature become abnormally higher than the average for the cargo. Thus, uniformity of moisture content among sublots and average moisture values of 14% or below are important for minimizing the risk of hot spots developing during transit.
1MWPS-13. 1988. Grain drying, handling and storage handbook. Midwest Plan Service No. 13. Iowa State University, Ames, IA 50011.
Results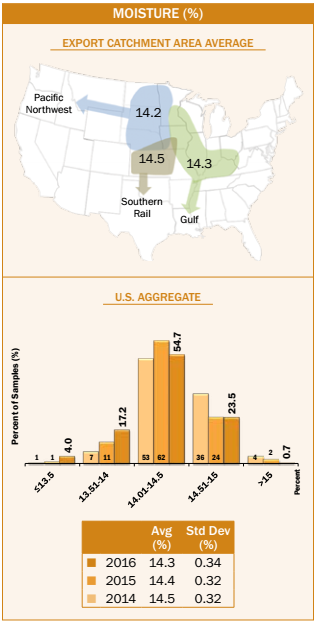
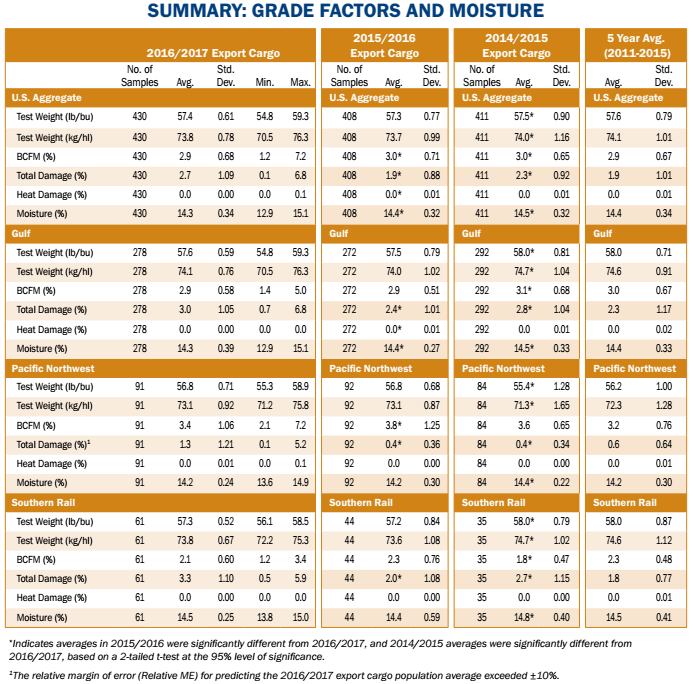
- Average U.S. Aggregate moisture content (14.3%) was nearly the same as 2015/2016 (14.4%), 2014/2015 (14.5%), and 5YA (14.4%).
- Moisture content variability among samples for 2016/2017 (standard deviation of 0.34%) was essentially the same as the previous two years (both 0.32%) and 5YA (0.34%).
- Sample moisture content ranged from 12.9% to 15.1% or 2.2 percentage points, compared to 2015/2016 (range of 2.7 percentage points) and 2014/2015 (range of 2.6 percentage points).
- Only 24.2% of the samples had moisture content above 14.5%, compared to 26% in 2015/2016 and 40% in 2014/2015.
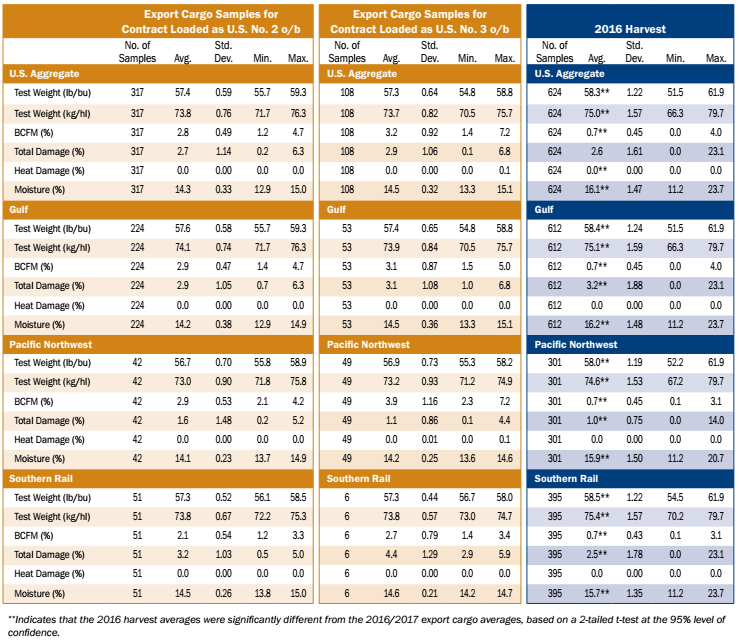
- Average moisture content decreased between harvest (16.1%) and export (14.3%) and uniformity among samples increased, as indicated by the lower standard deviation at export (0.34%) compared to harvest (1.47%). Uniformity in moisture content increases between harvest and export as the corn from various sources is commingled and conditioned to bring it to the desired moisture content.
- The Pacific Northwest ECA average moisture content (14.2%) was lower than the Gulf (14.3%) and Southern Rail (14.5%) ECAs, and maintained the lowest average moisture content among the three ECAs for 2015/2016, 2014/2015, and 5YA.
- Average moisture was slightly lower for contracts loaded as U.S. No. 2 o/b (14.3%) than for contracts loaded as U.S. No. 3 o/b (14.5%). The moisture range for U.S. No 2 o/b (12.9 to 15.0%) was wider than the range for U.S. No 3 o/b (13.3 to 15.1%). However, the moisture standard deviations for U.S. No. 2 o/b (0.33%) and U.S. No. 3 o/b (0.32%) were similar.