D. PHYSICAL FACTORS
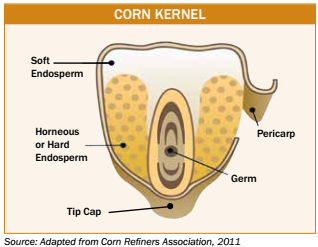
Physical factors are other quality attributes that are neither grade factors nor chemical composition. Physical factors include stress cracks, kernel weight, kernel volume, true density, percent whole kernels, and percent horneous (hard) endosperm. Tests for these physical factors provide additional information about the processing characteristics of corn for various uses, as well as corn’s storability and potential for breakage in handling. These quality attributes are influenced by the physical composition of the corn kernel, which is in turn affected by genetics, as well as growing and handling conditions. Corn kernels are made up of four parts: the germ or embryo, the tip cap, the pericarp or outer covering, and the endosperm. The endosperm represents about 82% of the kernel and consists of soft (also referred to as floury or opaque) endosperm and of horneous (also called hard or vitreous) endosperm, as shown above. The endosperm contains primarily starch and protein, the germ contains oil and some proteins, and the pericarp and tip cap are mostly fiber.
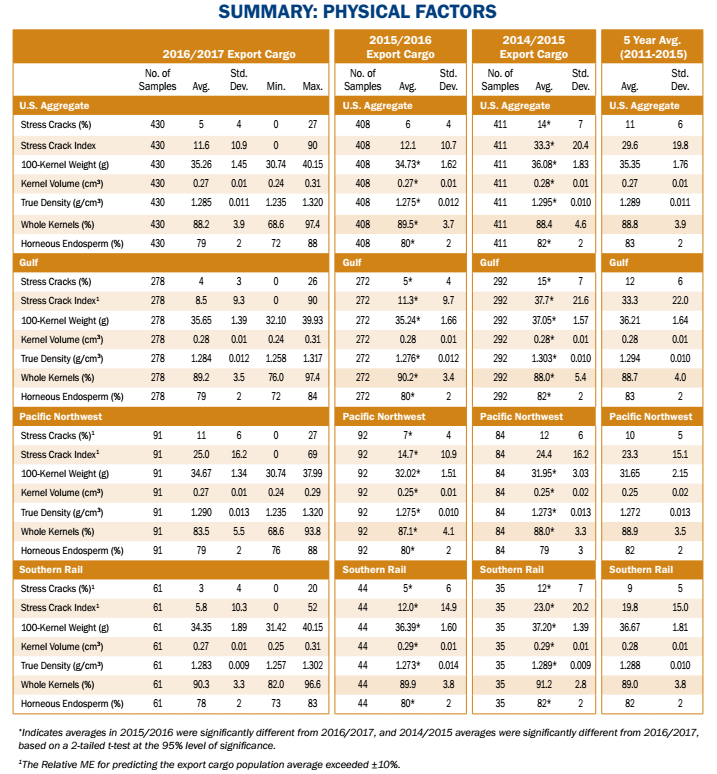
SUMMARY: PHYSICAL FACTORS
- Average U.S. Aggregate stress cracks (5%) was lower than 2015/2016 and 5YA. The low stress cracks percent in 2016/2017 was likely a result of good field drying conditions.
- The majority of the export samples (94.4%) had less than 15% stress cracks, and should have low rates of breakage during handling.
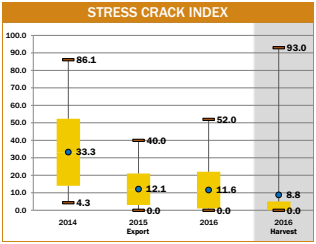
- Average U.S. Aggregate stress crack index (SCI) (11.6) was similar to 2015/2016 but lower than 5YA.
- The 2016/2017 and the 2015/2016 export samples had nearly the same percentage of samples with SCI of 20 or higher. The 2014/2015 samples had a much greater number of double and multiple stress cracks than 2015/2016 and 2016/2017.
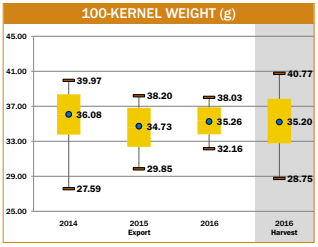
- Average U.S. Aggregate 100-kernel (100-k) weight (35.26g) was higher than 2015/2016 and similar to 5YA.
- Average 100-k weight for the Gulf ECA (35.65 g) was higher than the Pacific Northwest (34.67 g) and the Southern Rail (34.35 g) ECAs.
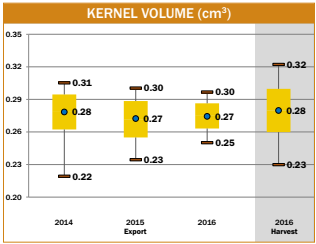
- Average U.S. Aggregate kernel volume (0.27 cm3) was the same as 2015/2016 and 5YA. Average kernel volume at export was lower than for 2016 harvest, whereas the export and harvest 5YA kernel volumes were the same.
- Average kernel volume was smaller for the Pacific Northwest and Southern Rail ECAs (both 0.27 cm3) than for the Gulf ECA (0.28 cm3) in 2016/2017. The Pacific Northwest ECA had the lowest average kernel volume for 2015/2016, 2014/2015, and 5YA, indicating smaller kernel sizes for the Pacific Northwest ECA than for the Gulf and Southern Rail ECAs.
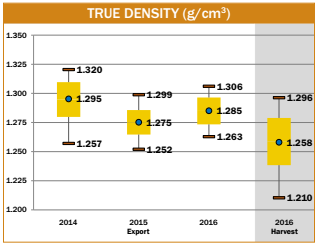
- Average U.S. Aggregate true density (1.285 g/cm3) was higher than 2015/2016 and similar to 5YA.
- For the 2016/2017 export samples, 80.7% had kernel true densities equal to or above 1.275 g/cm3, indicating a larger percentage of kernels with high true densities than in 2015/2016, but similar to 2014/2015.
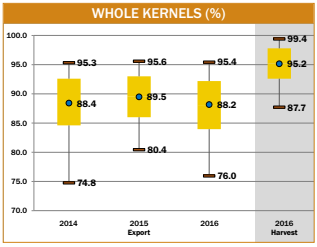
- The average percent of whole kernels at export (88.2%) was slightly lower than 2015/2016 and 5YA.
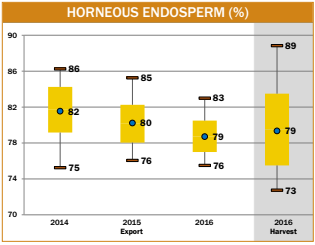
- Average U.S. Aggregate horneous endosperm (79%) was lower than 2015/2016 and 5YA.
- Only 25.3% of the 2016/2017 export samples had 80% or more horneous endosperm. This percentage is less than 2015/2016 and 2014/2015.

Stress Cracks and Stress Crack Index (SCI)
Stress cracks are internal fissures in the horneous (hard) endosperm of a corn kernel. The pericarp (or outer covering) of a stress-cracked kernel is typically not damaged, so the kernel may appear unaffected at first glance even if stress cracks are present.
The cause of stress cracks is pressure buildup due to moisture and temperature differences within the kernel’s horneous endosperm. This can be likened to the internal cracks that appear when an ice cube is dropped into a lukewarm beverage. The internal stresses do not build up as much in the soft, floury endosperm as in the horneous endosperm; therefore, corn with a higher percentage of horneous endosperm is more susceptible to stress cracking than softer grain. A kernel may vary in severity of stress cracking and can have one, two, or multiple stress cracks. The impact of high levels of stress cracks on various uses include:
- General: Increased susceptibility to breakage during handling. This may lead to processors needing to remove more broken corn during cleaning operations and a possible reduction in grade and/or value.
- Wet Milling: Lower starch yields due to increased difficulty in separating the starch and protein. Stress cracks may also alter steeping requirements.
- Dry Milling: Lower yield of large flaking grits (the prime product of many dry milling operations).
- Alkaline Cooking: Non-uniform water absorption leading to overcooking or undercooking, which affects the process balance.
High-temperature drying is the most common cause of stress cracks. Growing conditions will affect crop maturity, timeliness of harvest, and the need for artificial drying, which will influence the degree of stress cracking found from region to region. Then, as corn moves through the market channel, some stresscracked kernels break, which increases the proportion of broken corn. Concurrently, impacts of kernels on other kernels or on metal surfaces during handling may cause new cracks in kernels. As a result, the percentage of kernels with stress cracks may not remain constant throughout the market channel.
Stress crack measurements include “stress cracks” (the percent of kernels with at least one crack) and stress crack index (SCI), which is the weighted average of single, double, and multiple stress cracks. “Stress cracks” measures only the number of kernels with stress cracks, whereas SCI shows the severity of cracking. For example, if half the kernels have only single stress cracks, “stress cracks” is 50% and the SCI is 50 (50 x 1). However, if half the kernels have multiple stress cracks (more than two cracks), indicating a higher potential for handling issues, “stress cracks” remain at 50% but the SCI becomes 250 (50 x 5). Lower values for “stress cracks” and the SCI are always more desirable. In years with high levels of stress cracks, the SCI provides valuable information because high SCI values (perhaps 300 to 500) indicate the sample had a very high percentage of multiple stress cracks. Multiple stress cracks are generally more detrimental to quality changes than single stress cracks.
Results: Stress cracks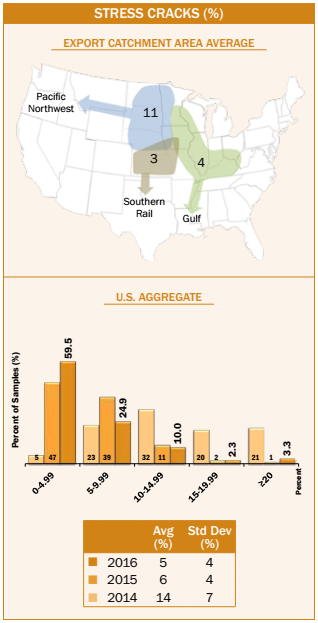
- Average U.S. Aggregate stress cracks (5%) were lower than 2015/2016 (6%) and 5YA (11%).
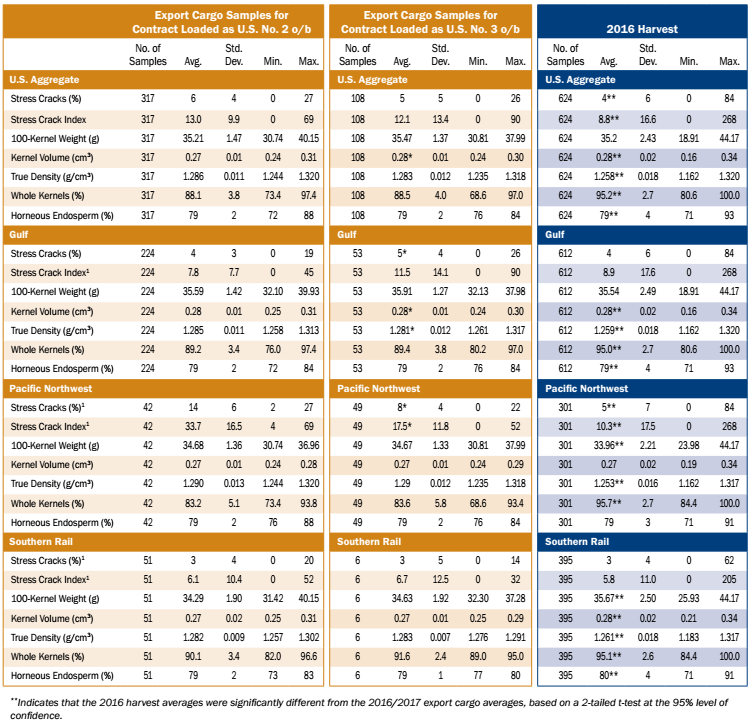
- Average U.S. Aggregate stress cracks (5%) were higher than the 2016 harvest samples (4%). Average U.S. Aggregate stress cracks have increased from 1 to 6 percentage points between harvest and export for each of the last three years and for 5YA.
- Stress cracks in the export samples (with a range of 0 to 27% and a standard deviation of 4%) were more uniform than in the 2016 harvest samples (with a range of 0 to 84% and a standard deviation of 6%).
- Of the 2016/2017 export samples, 94.4% had less than 15% stress cracks, compared to 97% in 2015/2016 and 60% in 2014/2015. Samples with less than 15% stress cracks should have relatively low rates of breakage during handling.
- Stress cracks averages were 4%, 11%, and 3% for the Gulf, Pacific Northwest, and Southern Rail ECAs, respectively. The stress cracks standard deviation ranged from 3 to 6% across all ECAs.
- Average stress cracks for contracts loaded as U.S. No. 2 o/b was 6%, while average stress cracks for contracts loaded as U.S. No. 3 o/b was 5%.
Results: Stress Crack Index (SCI)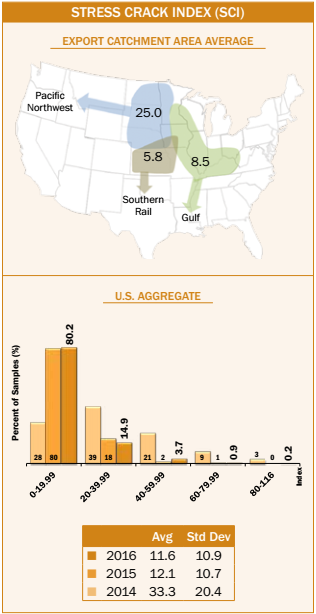
- Average U.S. Aggregate stress crack index (SCI) (11.6) was similar to 2015/2016 (12.1) but lower than 5YA (29.6).
- SCI in the export samples (with a range of 90 and a standard deviation of 10.9) had similar uniformity to 2015/2016 (with a range of 64 and a standard deviation of 10.7), but was more uniform than 2014/2015 (with a range of 116 and a standard deviation of 20.4).
- Average U.S. Aggregate SCI at export was higher than the average U.S. Aggregate SCI found at harvest (8.8).
- Average SCI was lowest for the Southern Rail ECA (5.8) and the highest for the Pacific Northwest ECA (25.0). Average SCI for the Gulf ECA was 8.5.
- SCI standard deviations across ECAs were 9.3, 16.2, and 10.3 for the Gulf, Pacific Northwest, and Southern Rail ECAs, respectively.
- In 2016/2017, 19.7% of the samples had SCI of 20 or higher, compared to 21% in 2015/2016 and 72% in 2014/2015. This indicates fewer samples had double or multiple stress cracks in 2016/2017 and 2015/2016 than in 2014/2015.
- SCI for contracts loaded as U.S. No. 2 o/b (13.0) was slightly higher than contracts loaded as U.S. No. 3 o/b (12.1).
100-Kernel Weight
100-kernel (100-k) weight (reported in grams) indicates larger kernel size as 100-k weights increase. Kernel size affects drying rates. As kernel size increases, the volume-to-surface area ratio becomes higher, and as this ratio gets higher, drying becomes slower. In addition, large uniform-sized kernels often enable higher flaking grit yields in dry milling. Kernel weights tend to be higher for specialty varieties of corn that have high amounts of horneous (hard) endosperm.
Results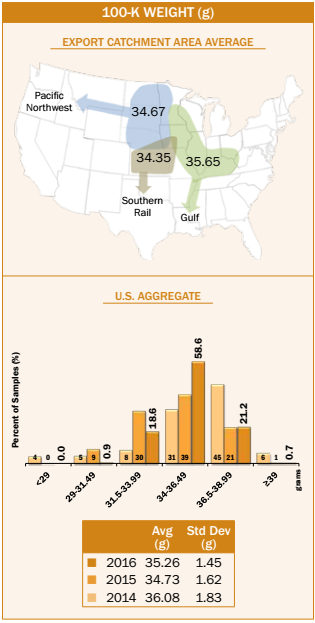
- Average U.S. Aggregate 100-k weight (35.26 g) was higher than 2015/2016 (34.73 g) but close to 5YA (35.35 g).
- The 100-k weight values for the 2016/2017 samples ranged from 30.74 to 40.15 g.
- Average 100-k weight for export and harvest (35.20 g) were similar. However, in years 2011/2012 through 2015/2016, average 100-k weights ranged from 0.39 to 2.05 g higher at export than at harvest. Since 100-k weight is based on 100 fully intact kernels, breakage or reduction in whole kernels occurring in transit may have self-selected out small kernels with low 100-k weights that might have been more prone to breakage.
- The export samples had a lower standard deviation (1.45 g) than the 2016 harvest samples (2.43 g). The 100-k weight standard deviation was also lower at export than at harvest for 2015/2016, 2014/2015, and 5YA, indicating greater uniformity at export than at harvest.
- The average 100-k weight for the Gulf ECA (35.65 g) was higher than the Pacific Northwest (34.67 g) and the Southern Rail (34.35 g) ECAs.
- In 2016/2017, 78.1% of the samples had 100-k weight of less than 36.5 g, compared to 78% in 2015/2016 and 48% in 2014/2015.
- 100-k weight for contracts loaded as U.S. No. 2 o/b (35.21 g) was slightly lower than for contracts loaded as U.S. No. 3 o/b (35.47 g).
Kernel Volume
Kernel volume in cubic centimeters (cm3) is often indicative of growing conditions. Small or round kernels are more difficult to degerm. Additionally, small kernels may lead to increased cleanout losses for processors and higher yields of fiber.
Results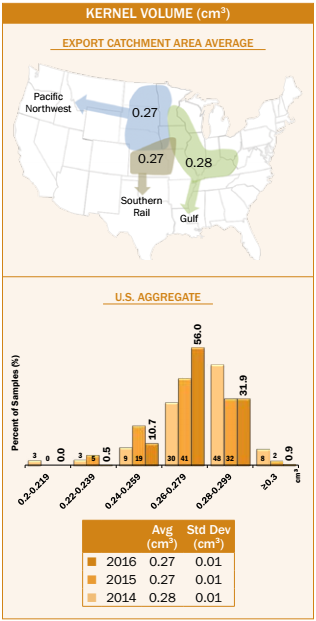
- Average U.S. Aggregate kernel volume (0.27 cm3) was the same as 2015/2016 and 5YA.
- Kernel volume range (0.24 to 0.31 cm3) was similar to the 2015/2016 range (0.23 to 0.31 cm3).
- The kernel volume standard deviation (0.01 cm3) was the same as 2015/2016 and 5YA.
- Average U.S. Aggregate kernel volume at export was lower than at harvest (0.28 cm3) in 2016/2017, but the same as the export and harvest 5YAs (both 0.27 cm3).
- Average kernel volume was smaller for the Pacific Northwest and Southern Rail ECAs (both 0.27 cm3) than for the Gulf ECA (0.28 cm3) in 2016/2017. The Pacific Northwest ECA had the lowest average kernel volume for 2015/2016, 2014/2015, and 5YA.
- Of the 2016/2017 export samples, 88.8% had kernel volumes equal to or greater than 0.26 cm3, compared to 75% in 2015/2016 and 86% in 2014/2015, which indicates a similar percentage of large kernels over the past two years.
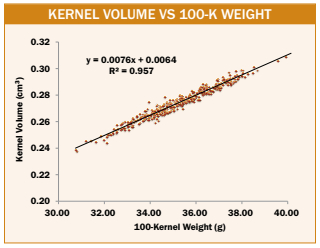 There is a positive relationship for the 2016/2017 export corn between kernel volume and 100-kernel weight, as shown in the adjacent figure (the correlation coefficient is 0.98). This indicates that the higher the weight of 100 kernels of corn, the greater the kernel volume.
- Average kernel volume for contracts loaded as U.S. No. 2 o/b (0.27 cm3) was slightly lower than contracts loaded as U.S. No. 3 o/b (0.28 cm3).
Kernel True Density
Kernel true density is calculated as the weight of a 100-kernel sample divided by the volume, or displacement, of those 100 kernels and is reported as grams per cubic centimeter (g/cm3). True density is a relative indicator of kernel hardness, which is useful for alkaline processors and dry millers. True density may be affected by the genetics of the corn hybrid and the growing environment. Corn with higher density is typically less susceptible to breakage in handling than lower density corn, but is also more at risk for the development of stress cracks if high-temperature drying is employed. True densities above 1.30 g/cm3 indicate very hard corn, which is typically desirable for dry milling and alkaline processing. True densities near the 1.275 g/cm3 level and below tend to be softer, but process well for wet milling and feed use.
Results
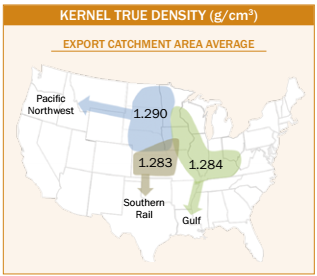
- Average U.S. Aggregate kernel true density (1.285 g/cm3) was higher than 2015/2016 (1.275 g/cm3) and similar to 5YA (1.289 g/cm3).
- Average kernel true density for the 2016/2017 export samples was higher than for the 2016 harvest samples (1.258 g/cm3), and the export 5YA true density (1.289 g/cm3) was higher than the harvest 5YA true density (1.263 g/cm3). Average true densities have been 0.021 to 0.036 g/cm3 higher at export than at harvest over the past six years.
- The 2016/2017 export samples had a range of 1.235 to 1.320 g/cm3 (with a standard deviation of 0.011 g/cm3), while the 2016 harvest samples had a wider range (1.162 to 1.320 g/cm3) and a larger standard deviation (0.018 g/cm3).
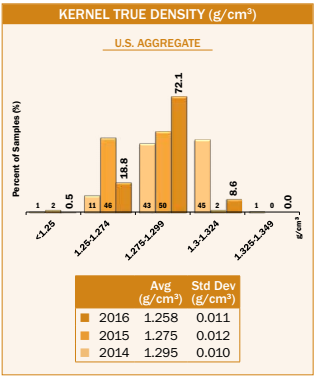
- For the 2016/2017 export samples, 80.7% had kernel true densities equal to or above 1.275 g/cm3, compared with only 52% in 2015/2016 and 88% in 2014/2015. This indicates a higher percentage of kernels with high true densities in 2016/2017 than in the previous year, but with true densities similar to 2014/2015.
- Average kernel true densities were similar for the Gulf (1.284 g/cm3), Pacific Northwest (1.290 g/ cm3), and Southern Rail (1.283 g/cm3) ECAs.
- Average kernel true density for contracts loaded as U.S. No. 2 o/b (1.286 g/ cm3) was slightly higher than for contracts loaded as U.S. No. 3 o/b (1.283 g/ cm3). Bulk density or test weight was also slightly higher for contracts loaded as U.S. No. 2 o/b (57.4 lb/bu) than contracts loaded as U.S. No. 3 o/b (57.3 lb/bu).
Whole Kernels
Though the name suggests some inverse relationship between whole kernels, and broken corn and foreign material (BCFM), the whole kernels test conveys different information than the broken corn portion of the BCFM test. Broken corn is defined solely by the size of the material. Whole kernels, as the name implies, is the percent of fully intact kernels in the sample with no pericarp damage or kernel pieces chipped away.
The exterior integrity of the corn kernel is very important for two key reasons. First, it affects water absorption for alkaline cooking and steeping operations. Kernel nicks or pericarp cracks allow water to enter the kernel faster than fully intact or whole kernels. Too much water uptake during cooking can result in loss of solubles, non-uniform cooking, expensive shutdown time, and/or products that do not meet specifications.
Second, intact whole kernels are less susceptible to mold invasion during storage and to breakage during handling. While hard endosperm lends itself to preservation of more whole kernels than soft corn does, the primary factor in delivering whole kernels is harvesting and handling. This begins with proper combine adjustment, followed by minimizing the severity of kernel impacts due to conveyors and the number of handlings required from the farm field to the end user. Each subsequent handling will generate additional breakage. Some companies pay contracted premiums for corn delivered above a specified level of whole kernels.
Results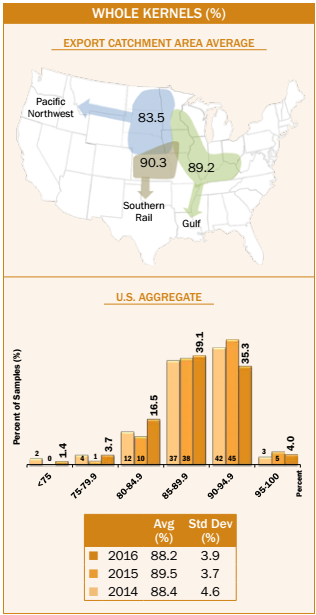
- Average U.S. Aggregate whole kernels (88.2%) was lower than 2015/2016 (89.5%) but close to the same as 5YA (88.8%).
- The average percentage of whole kernels at export was lower than at harvest (95.2%). Whole kernels for the export 5YA (88.8%) was also lower than for harvest 5YA (93.8%). The reduction in whole kernels from harvest to export is likely caused by the additional handling in transport to export loading locations.
- The 2016/2017 export samples had a range of 68.6 to 97.4% whole kernels (with a standard deviation of 3.9%), while the 2016 harvest samples had a narrower range (80.6 to 100.0%) and a lower standard deviation (2.7%).
- The decrease in average and increase in variability of whole kernels from harvest to export also occurred in 2015/2016, 2014/2015, and for 5YA.
- The Southern Rail ECA (90.3%) had the highest average whole kernels compared to the Gulf (89.2%) and Pacific Northwest (83.5%) ECAs. In 2016/2017, the Pacific Northwest ECA also had the lowest percentage of whole kernels; however, the 5YA for the three ECAs were within 0.3 percentage points of each other.
- The percentage of 2016/2017 export samples with whole kernels greater than or equal to 90% was 39.3%, compared to 50% in 2015/2016 and 45% in 2014/2015.
- Average whole kernels for contracts loaded as U.S. No. 2 o/b was 88.1%, compared to 88.5% found for contracts loaded as U.S. No. 3 o/b.
Horneous (Hard) Endosperm
The horneous (hard) endosperm test measures the percent of horneous or hard endosperm out of the total endosperm in a kernel, with a potential value from 70 to 100%. The greater the amount of horneous endosperm relative to soft endosperm, the harder the corn kernel is said to be. The degree of hardness is important to the type of intended processing. Hard corn is needed to produce high yields of large-flaking grits in dry milling. Medium-high to medium hardness is desired for alkaline cooking. Moderate to soft hardness is used for wet milling and livestock feeding.
Hardness has been correlated with breakage susceptibility, feed utilization/efficiency, and starch digestibility. As a test of overall hardness, there is no good or bad value for horneous endosperm; there is only a preference by different end users for particular ranges. Many dry millers and alkaline cookers would like greater than 90% horneous endosperm, while wet millers and feeders would typically prefer values between 70 and 85%. However, there are certainly exceptions in user preference.
Results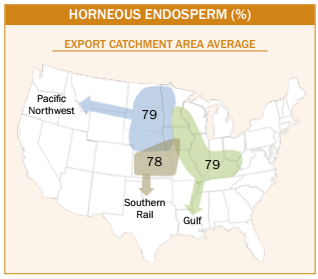
- Average U.S. Aggregate horneous endosperm (79%) was lower than 2015/2016 (80%) and 5YA (83%).
- Average horneous endosperm for 2016/2017, 2015/2016, 2014/2015, and export 5YA were within ±1% of the average horneous endosperm for 2016, 2015, 2014, and 5YA at harvest, respectively.
- The 2016/2017 export samples for horneous endosperm had a smaller range (72 to 88%) and standard deviation (2%) than the 2016 harvest samples. This same pattern of increased uniformity for export samples compared to harvest samples occurred in 2015/2016, 2014/2015, and 5YA also.
- Average horneous endosperm was within 1, 0, 3, and 1 percentage points of each other among all ECAs for 2016/2017, 2015/2016, 2014/2015, and 5YA, respectively.
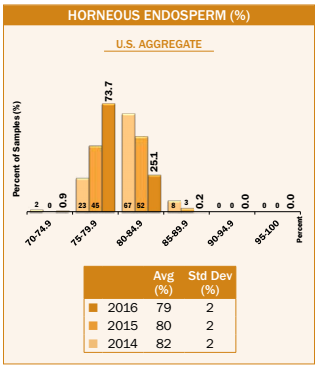
- Only 25.3% of the 2016/2017 export samples had at least 80% horneous endosperm, in contrast to 55% in 2015/2016 and 75% in 2014/2015, indicating a lower percentage of the 2016/2017 samples contained a higher percentage of horneous endosperm than in the two previous years.
- Average horneous endosperm for contracts loaded as U.S. No. 2 o/b and as U.S. No. 3 o/b were both 79%.