Quality Test Results
A. Grade Factors
The U.S. Department of Agriculture (USDA) Federal Grain Inspection Service (FGIS) has established numerical grades, definitions, and standards for measurement of many quality attributes. The attributes which determine the numerical grades for corn are test weight, broken corn and foreign material (BCFM), total damage, and heat damage. The table for “U.S. Corn Grades and Grade Requirements” is provided on page 66 of this report.
Summary: Grade Factors and Moisture
- Average U.S. Aggregate test weight (57.4 lb/bu or 73.8 kg/hl) was slightly higher than 2015/2016, slightly lower than 5YA (57.6 lb/bu or 74.1 kg/hl), and well above the limit for U.S. No. 1 grade corn (56 lb/bu).
- Average U.S. Aggregate BCFM (2.9%) was slightly below 2015/2016 but was same as 5YA. Approximately 63.3% of the export samples contained levels at or below the maximum allowed for U.S. No. 2 grade (3%) and 91.9% at or below the limit for U.S. No. 3 grade (4.0%).
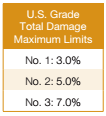
- Average U.S. Aggregate total damage (2.7%) was higher than 2015/2016 (1.9%) and 5YA (1.9%), but below the limit for U.S. No. 1 grade (3.0%).
- The Pacific Northwest ECA at export had the lowest average total damage among the three ECAs for each of last three years and for 5YA.
- Average U.S. Aggregate heat damage was 0.0% for 2016/2017, the last two years, and 5YA.
- Test weight, total damage, and heat damage averages for contracts loaded as U.S. No. 2 o/b and contracts loaded as U.S. No. 3 o/b were better than U.S. No. 1 grade limits.
- BCFM averages were at or below the limits of the U.S. No. 2 o/b and U.S. No. 3 o/b contract limits.
- Average U.S. Aggregate moisture content (14.3%) was nearly the same as 2015/2016 and 5YA (14.4%). Only 24.2% of the samples had moisture content above 14.5%, which was less than 2015/2016 and 2014/2015.
- The Pacific Northwest ECA average moisture (14.2%) was lower than the Gulf (14.3%) and Southern Rail (14.5%) ECAs. The Pacific Northwest ECA had the lowest average moisture content among ECAs for each of last three years and for 5YA.
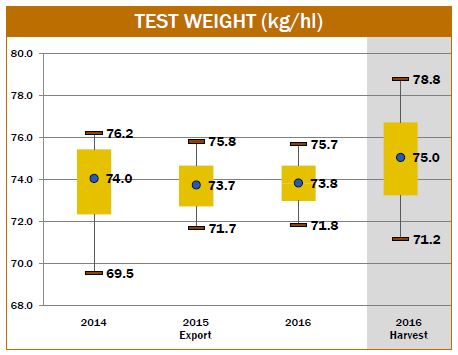
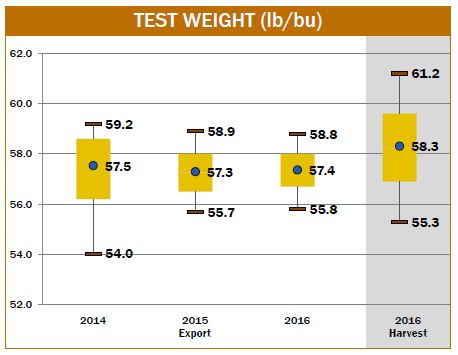

Test Weight
Test weight (weight per volume) is a measure of bulk density and is often used as a general indicator of overall quality and as a gauge of endosperm hardness for alkaline cookers and dry millers. High test weight corn takes up less storage space than the same weight of corn with a lower test weight. Test weight is initially impacted by genetic differences in the structure of the kernel. However, it is also affected by moisture content, method of drying, physical damage to the kernel (broken kernels and scuffed surfaces), foreign material in the sample, kernel size, stress during the growing season, kernel maturity, kernel hardness, and microbiological damage. Test weight often correlates positively with true density. High test weight at the export point generally indicates high quality, a high percent of horneous (or hard) endosperm, and sound, clean corn.
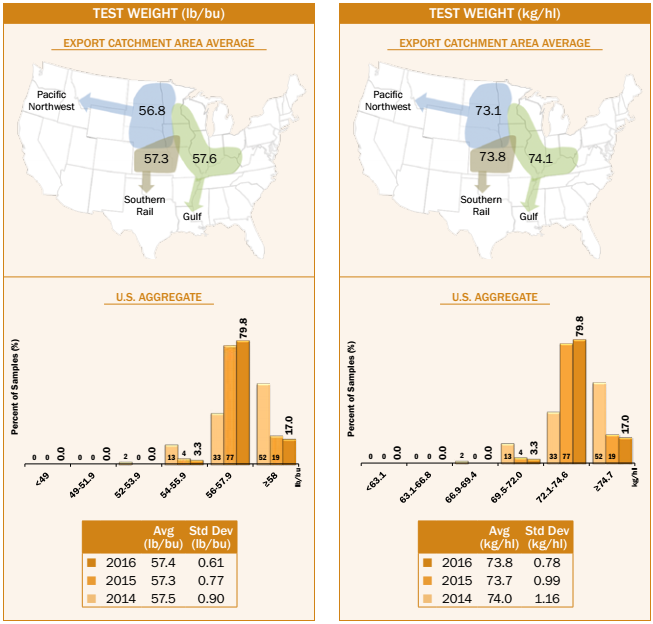
- Average U.S. Aggregate test weight (57.4 lb/bu or 73.8 kg/hl) was slightly higher than in 2015/2016 (57.3 lb/bu), slightly lower than 5YA (57.6 lb/bu), and well above the limit for U.S. No.1 grade (56.0 lb/bu).
- The 2016/2017 export samples had less variation, as indicated by the lower standard deviation (0.61 lb/bu), than 2015/2016 (0.77 lb/bu) and 5YA (0.79 lb/bu). The range in values was also less in 2016/2017 (4.5 lb/bu) than in 2015/2016 (6.4 lb/bu) and 2014/2015 (7.2 lb/bu).
- Test weight for 96.8% of the samples was at or above the minimum for U.S. No. 1 grade (56 lb/ bu), and 100% of the samples were at or above the limit for U.S. No. 2 grade (54 lb/bu).

- Average U.S. Aggregate test weight at export (57.4 lb/bu or 73.8 kg/hl) was lower than at 2016 harvest (58.3 lb/bu or 75.0 kg/hl). Average test weight at export has been consistently lower than at harvest, as indicated by export 5YA (57.6 lb/bu or 74.1 kg/hl) and harvest 5YA (58.1 lb/bu or 74.8 kg/hl).
- The 2016/2017 export samples’ variability (standard deviation of 0.61 lb/bu) was about half that of the 2016 harvest samples (1.22 lb/bu). As corn is commingled moving through the market channel, test weight becomes more uniform, with a lower standard deviation and a smaller range between maximum and minimum values than at harvest. At export, 5YA standard deviation was 0.79 lb/bu, compared to harvest 5YA standard deviation of 1.33 lb/bu.
- Average test weight was higher for the Gulf ECA (57.6 lb/bu) than for the Pacific Northwest (56.8 lb/bu) and the Southern Rail (57.3 lb/bu) ECAs.
- Average test weight of corn for contracts loaded as U.S. No. 2 o/b (57.4 lb/bu) was slightly higher than contracts loaded as U.S. No. 3 o/b (57.3 lb/bu). Averages for both contracts were above the limit for U.S. No. 1 grade.
Broken Corn and Foreign Material (BCFM)
Broken corn and foreign material (BCFM) is an indicator of the amount of clean, sound corn available for feeding and processing. As corn moves from farm deliveries through the market channel, each impact on the grain during handling and transporting increases the amount of broken corn. As a result, the average BCFM in most shipments of corn will be higher at the export point than in deliveries from the farm to the local elevator.
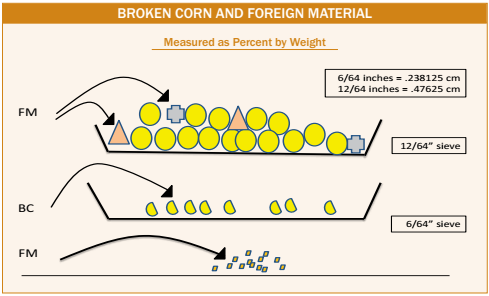
Broken corn (BC) is defined as corn and any other material (such as weed seeds) small enough to pass through a 12/64th inch round-hole sieve, but too large to pass through a 6/64th inch round-hole sieve.
Foreign material (FM) is defined as any non-corn material too large to pass through a 12/64th inch round-hole sieve, as well as all fine material small enough to pass through a 6/64th inch round-hole sieve. Thus, FM consists of Coarse Foreign Material (CFM) retained on the 16/64th inch sieve and fine material passing through the 6/64th inch sieve. CFM is primarily non-grain material, and fine material is largely composed of corn dust and weed seeds. Loading, transport, and discharge cannot alter CFM, but impacts during loading and discharge will increase BC and fines.
The illustration below depicts the measurement of broken corn and foreign material for the U.S. corn grades.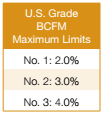
Results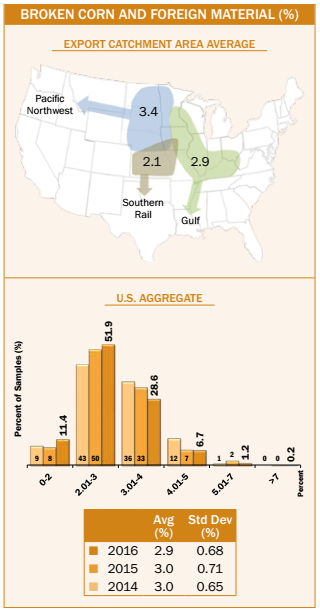
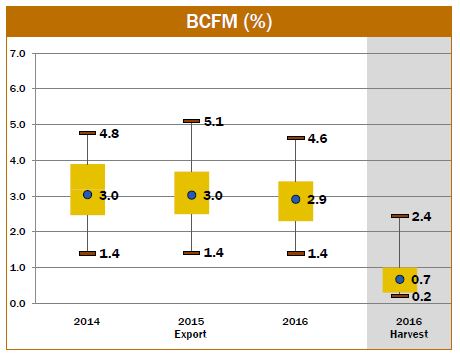
- Average U.S. Aggregate BCFM in export samples (2.9%) was slightly lower than 2015/2016 (3.0%), but the same as 5YA (2.9%). Average BCFM was below U.S. No. 2 grade (3.0%).
- The variability of the 2016/2017 export samples (with a standard deviation of 0.68%) was lower than 2015/2016 (0.71%) and very close to 5YA (0.67%). The range in values (6.0%) was less than in 2015/2016 (10.5%), but greater than 2014/2015 (4.4%).
- BCFM in the 2016/2017 export samples was distributed with 63.3% of the samples at or below the limit for U.S. No. 2 grade (3%), and 91.9% at or below the limit for U.S. No. 3 grade (4%).
- Average U.S. Aggregate BCFM at export (2.9%) was 2.2 percentage points higher than at harvest (0.7%). This increase is slightly higher than the 5YA increase of 2.1 percentage points (harvest 5YA was 0.8% compared to export 5YA of 2.9%). This increase is likely a result of drying and increased breakage that occurs with additional impacts caused by conveying, dropping, and handling.
- Average Southern Rail ECA BCFM (2.1%) was lower than either the Gulf (2.9%) or Pacific Northwest (3.4%) ECAs. Average BCFM for the Southern Rail ECA has also been lowest among the ECAs for the previous two years and 5YA.
- Average BCFM for contracts loaded as U.S. No. 2 o/b was 2.8%, compared to the average BCFM of 3.2% for contracts loaded as U.S. No. 3 o/b. Corn arriving at the export point is normally commingled from many origins to not exceed the limits for the contracted grade.
Total Damage
Total damage is the percentage of kernels and pieces of kernels that are visually damaged in some way, including damage from heat, frost, insects, sprouting, disease, weather, ground, germ, and mold. Most of these types of damage result in some sort of discoloration or change in kernel texture. Damage does not include broken pieces of grain that are otherwise normal in appearance. Mold damage and the associated potential for mycotoxins is the damage factor of greatest concern. Mold damage is usually associated with higher moisture content and high temperature conditions during growing or storage.
Corn with low levels of total damage is more likely to arrive at destination in good condition than corn with high levels of total damage. High levels of total damage have the potential to increase moisture content and microbiological activity during transport.
Results
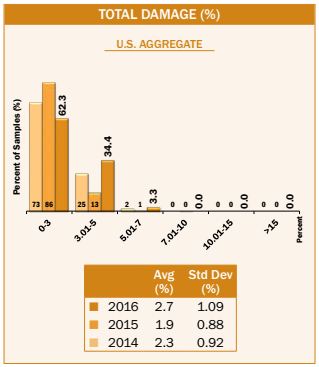
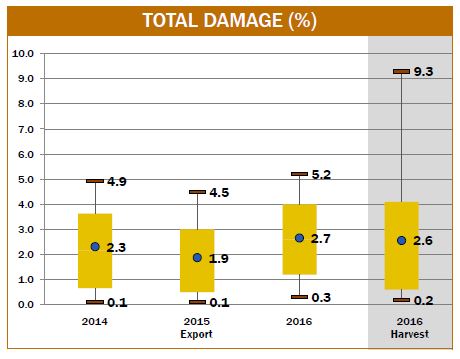
- Average U.S. Aggregate total damage (2.7%) was higher than 2015/2016 (1.9%) and 5YA (1.9%), but still below the limit (3.0%) for U.S. No. 1 grade.
- Variability in the 2016/2017 samples, as indicated by the standard deviation (1.09%), was greater than 2015/2016 (0.88%) and 5YA (1.01%). However, the 2016/2017 sample range (0.1 to 6.8%) was similar to the 2015/2016 range (0.0 to 7.2%).
- Of the export samples, 62.3% had 3.0% or less damaged kernels, meeting the requirement for U.S. No. 1 grade. In addition, 96.7% were at or below the limit for U.S. No. 2 grade (5.0%).
- The average level of total damage in the market channel at export (2.7%) was slightly higher than that at harvest (2.6%). Over the years, total damage at export usually has been higher than at harvest by anywhere from 0.1 to 1.2 percentage points (export 5YA of 1.9% compared to harvest 5YA of 1.2% for a difference of 0.7 percentage points for 5YA). Total damage can increase during storage, especially if there are spout lines and pockets of high moisture in the storage bins or in the transport containers. However, even with this modest increase, the U.S. Aggregate average was still below the limit for U.S. No. 1 grade (3.0%).
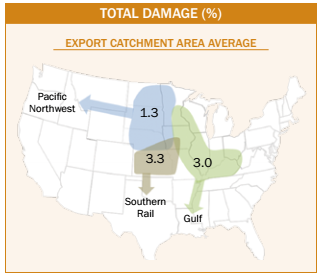
- The Pacific Northwest ECA had lower average total damage (1.3%) than the Gulf (3.0%) and the Southern Rail (3.3%) ECAs. The Pacific Northwest ECA also had the lowest average total damage among the ECAs for 2015/2016, 2014/2015, and 5YA.
- Average total damage for contracts being loaded as U.S. No. 2 o/b (2.7%) and as U.S. No. 3 o/b (2.9%) were below the limit for U.S. No. 1 grade (3.0%).
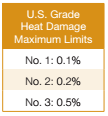
Heat Damage
Heat damage is a subset of total damage in corn grades and has separate allowances in the U.S. grade standards. Heat damage can be caused by microbiological activity in warm, moist grain or by high heat applied during drying. Low levels of heat damage may indicate the corn has been dried and stored at moisture contents and temperatures that prevent damage in the market channel.
Results
- Average U.S. Aggregate heat damage was 0.0%, the same as 2015/2016, 2014/2015, and 5YA. These averages have also been well below the limit for U.S. No. 1 grade in previous years, indicating good management of drying and storage of the corn throughout the market channel.
- Only one sample in the entire 2016/2017 export cargo sample set (total of 430 samples) showed any heat damage (0.1%).