
C. STATISTICAL ANALYSIS
The sample test results for the grade factors, moisture content, chemical composition, and physical factors were summarized for the U.S. Aggregate and also by the three ECAs (Gulf, Pacific Northwest, and Southern Rail) and two “contract grade” categories. Contract grades are described in the “U.S. Corn Export System” section on page 50. The two contract grade categories in the Export Cargo Report are:
- “U.S. No. 2” or “U.S. No. 2 or better” contracts specify that the corn must at least meet U.S. No. 2 factor limits or be better than U.S. No. 2 factor limits. This category is designated as U.S. No. 2 o/b.
- “U.S. No. 3” or “U.S. No. 3 or better” contracts specify that the corn must at least meet U.S. No. 3 factor limits or be better than U.S. No. 3 factor limits. This category is designated as U.S. No. 3 o/b.
Within this 2016/2017 Export Cargo Report is a simple average of the quality factors’ averages and standard deviations of the previous five Export Cargo Reports (2011/2012, 2012/2013, 2013/2014, 2014/2015, and 2015/2016). These simple averages are calculated for the U.S. Aggregate and each of the three ECAs and are referred to as “5YA” in the text and summary tables of the report. The Relative ME was calculated for each of the quality factors tested for this study at the U.S. Aggregate level and for each of the ECAs. The Relative ME was not more than ±10% for all the quality attributes at the U.S. Aggregate level. The Relative ME exceeded ±10% for three quality factors (see table below) in the three ECAs.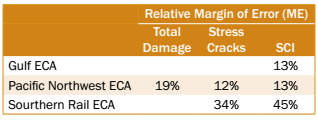
While the level of precision for these quality factors in the three ECAs is less than desired, the levels of Relative ME do not invalidate the estimates. The averages for the quality factors are the best possible unbiased estimates of the true population means. However, they are estimated with greater uncertainty than the quality factors with a Relative ME of less than ±10%. Footnotes in the summary tables for “Grade Factors and Moisture” and “Physical Factors” indicate the attributes for which the Relative ME exceeds ±10%. This allows the reader to keep in mind the greater degree of uncertainty of the sample average representing the true population mean.
References in the “Quality Test Results” section to statistical differences were validated by 2-tailed t-tests at the 95% confdence level. The t-tests were calculated:
- Between factors in the 2016/2017 Harvest Report and 2016/2017 Export Cargo Report; and
- Between factors in the 2016/2017 Export Cargo Report and 2015/2016 Export Cargo Report, and the 2016/2017 Export Cargo Report and 2014/2015 Export Cargo Report.
The U.S. Department of Agriculture (USDA) Federal Grain Inspection Service (FGIS) or FGIS-designated official service providers provided official grading and aflatoxin results from their normal inspection and testing procedures for each sublot corn sample collected. The 2016/2017 Corn Export Cargo Quality Report samples (approximately 6 pounds or 2,700 grams) were sent directly from the FGIS fieldd offices and official service providers to the Illinois Crop Improvement Association’s Identity Preserved Grain Laboratory (IPG Lab) in Champaign, Illinois, for chemical composition, physical factors, and DON (deoxynivalenol or vomitoxin) testing. Next, the samples were split into two subsamples using a Boerner divider, while keeping the attributes of the grain sample evenly distributed between the two subsamples. One subsample was analyzed for DON. The other subsample was analyzed for chemical composition and other physical factors following either industry norms or well-established procedures. IPG Lab has received accreditation under the ISO/IEC 17025:2005 International Standard for many of the tests. The full scope of accreditation is available at http://www.ilcrop.com/labservices.