C. Chemical Composition
The chemical composition of corn consists primarily of protein, starch and oil. These attributes are not grade factors but are of significant interest to end users. They provide information related to nutritional value for livestock and poultry feeding, for wet milling uses, and other processing uses of corn. Unlike many physical attributes, chemical composition values are not expected to change significantly during storage or transit.
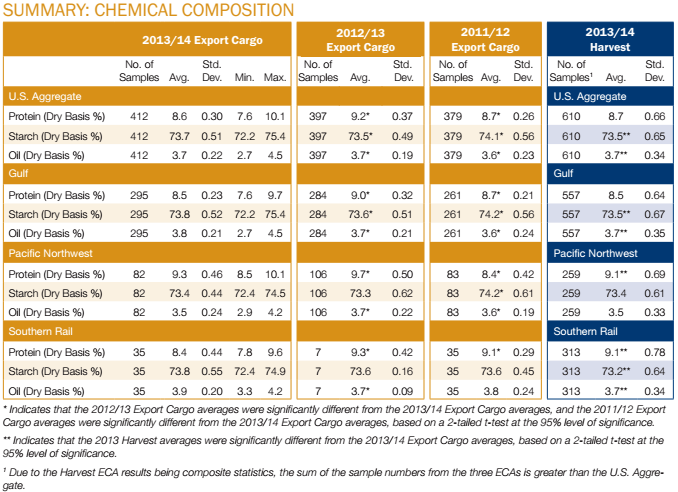
SUMMARY: CHEMICAL COMPOSITION
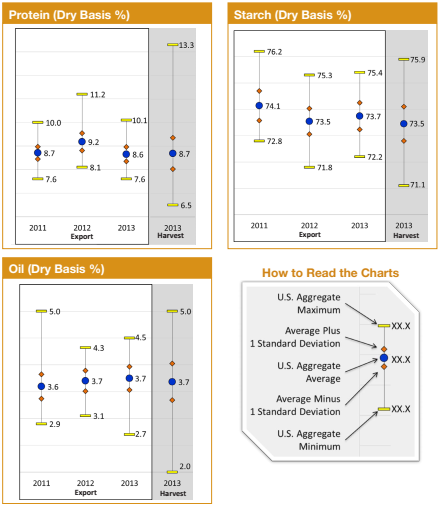
- Average protein content for the 2013/14 export and 2013 harvest samples were lower than found in the 2012/13 export and 2012 harvest samples, but appear to have returned closer to normal and were very close to the 2011/12 export and 2011 harvest levels.
- Starch contents followed the opposite of the protein trend, and for the 2013/14 export and 2013 harvest samples, average starch content was higher than found in the 2012/13 export and 2012 harvest samples.
- Oil content (3.7%) in the 2013/14 export samples was the same as that found in 2012/13 and in the 2013 harvest samples.
- Between ECAs, average oil contents (3.5%) for 2013/14 export and 2013 harvest samples were lower for the Pacific Northwest ECA than for the other two ECAs.
- Protein, starch and oil all had narrower ranges and lower standard deviations at export than at harvest. This finding is, in part, due to grains becoming more homogenous after aggregation from numerous harvest level sources.
1. Protein
Protein is very important for poultry and livestock feeding. It supplies essential sulfur-containing amino acids and helps to improve feed conversion efficiency. Protein is usually inversely related to starch content. Results are reported on a dry basis.
RESULTS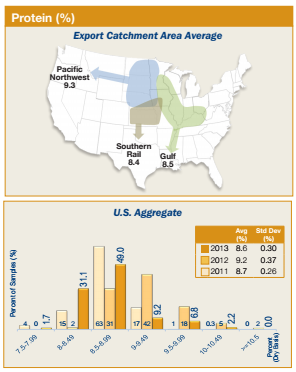
- U.S. Aggregate protein content was 8.6%, significantly lower than in 2012/13 (9.2%), but similar to 2011/12 (8.7%).
- While average protein content at export was similar to that at harvest (8.7%), the export samples (standard deviation of 0.30%) were more uniform than the harvest samples (standard deviation of 0.66%).
- Protein contents were distributed with 18.2% at or above 9%, compared to 67% of the 2012/13 export samples. Protein distributions in the 2013/14 and 2011/12 export samples were similar, but the results skewed to lower and more normal values than levels found in the 2012/13 samples.
- The Pacific Northwest ECA had higher average protein content (9.3%) than that found in the Gulf (8.5%) and Southern Rail (8.4%) ECAs.
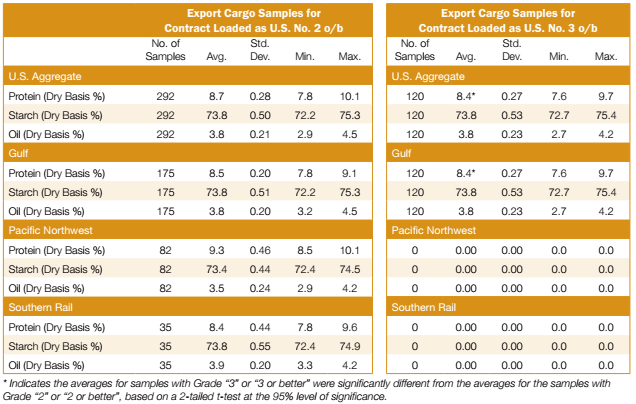
- Protein content averages were significantly higher for contracts loaded as U.S. No. 2 o/b (8.7%) than for those loaded as U.S. No. 3 o/b (8.4%). However, all three ECAs had contracts loaded as U.S. No. 2 o/b whereas only the Gulf ECA had contracts loaded as U.S. No. 3 o/b. The Gulf ECA contracts loaded as U.S. No. 2 o/b had higher protein content averages (8.5%) than the Gulf ECA contracts loaded as U.S. No. 3 o/b (8.4%).
2. Starch
Starch is an important factor for corn used by wet millers and dry-grind ethanol manufacturers. High starch content is often indicative of good kernel maturation/filling conditions and reasonably high kernel densities. Starch is usually inversely related to protein content. Results are reported on a dry basis.
RESULTS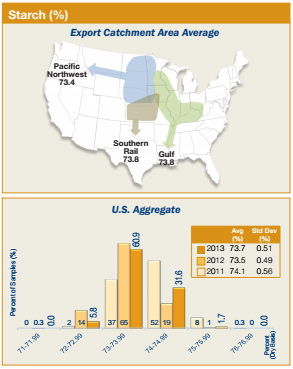
- U.S. Aggregate starch content was 73.7%, slightly higher than in 2012/13 (73.5%), but lower than in 2011/12 (74.1%).
- Starch contents were distributed with 33.3% at or above 74.0% compared with 2012/13 (20%) and 2011/12 (60.3%).
- The starch level at export (73.7%) was slightly higher than at harvest (73.5%). However, starch contents at export (standard deviation of 0.51%) were more uniform with a slightly lower standard deviation than in the 2013 harvest samples (standard deviation of 0.65%).
- In addition to the Pacific Northwest ECA having the highest average protein content, it also had lower average starch content (73.4%) than that found in the Gulf and Southern Rail ECAs, which both averaged 73.8%.
- Average starch content for the Gulf ECA in contracts loaded as U.S. No. 2 o/b (73.8%) was the same as for contracts loaded as U.S. No. 3 o/b (73.8%).
3. Oil
Oil is an essential component of poultry and livestock rations. It serves as an energy source, enables fat-soluble vitamins to be utilized, and provides certain essential fatty acids. Oil is also an important co-product of corn wet and dry milling. Results are reported on a dry basis.
RESULTS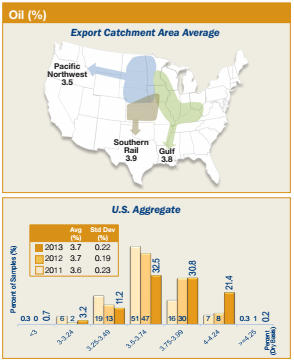
- U.S. Aggregate oil content was 3.7%, the same as that found in 2012/13 but slightly higher than in 2011/12 (3.6%).
- The average oil content at export was unchanged from harvest samples for the 2013 crop. The oil content standard deviation at export (0.22%) was lower than that found at harvest (0.34%).
- Oil content averages for the Gulf, Pacific Northwest and Southern Rail ECA export samples were 3.8%, 3.5% and 3.9%, respectively. The Pacific Northwest ECA also had the lowest average oil content (3.5%) for the 2013 harvest samples.
- Approximately 52.4% contained at least 3.75% oil, in contrast to 2012/13 (39.0%) and 2011/12 (23.3%).
- U.S. Aggregate and Gulf ECA average oil contents for contracts loaded as U.S. No. 2 o/b were 3.8%, which was the same as for contracts loaded as U.S. No. 3 o/b.