
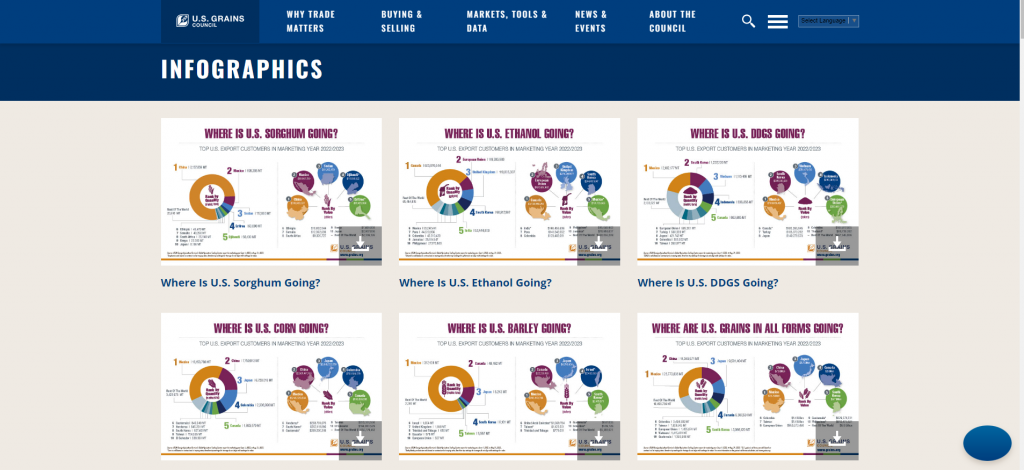
| The U.S. Grains Council (USGC) has once again released its annual set of infographics to highlight the 2022-2023 marketing year numbers for grains in all forms (GIAF), barley, corn, distiller’s dried grains with solubles (DDGS), ethanol and sorghum. “Having these infographics – broken down either by commodity or in an overall grains-in-all-forms version – are incredibly helpful when sharing news about exports by quantity and dollar value over the last year,” said USGC Communications Director Bryan Jernigan. “Each one highlights the top 10 buyers and is the perfect snapshot of the year we’ve just had.” This set of infographics includes: – Where Are U.S. Grains In All Forms (GIAF) Going?, a breakdown of where GIAF were exported the most in the 2022/2023 marketing year by quantity and value. –Where Is U.S. Barley Going?, an analysis of the top U.S. barley export customers in the 2022/2023 marketing year by quantity and value. – Where Is U.S. Corn Going?, an overview of the top U.S. corn export customers in the 2022/2023 marketing year by quantity and value. –Where Is U.S. DDGS Going?, an assessment of the top U.S. distiller’s dried grains with solubles (DDGS) export customers in the 2022/2023 marketing year by quantity and value. –Where Is U.S. Ethanol Going?, a review of the top U.S. ethanol export customers in the 2022/2023 marketing year by quantity and value. –Where Is U.S. Sorghum Going?, a summary of the top U.S. sorghum export customers in the 2022/2023 marketing year by quantity and value. The downloadable infographics offer access to the most recent marketing year’s data with images to complement the numbers they represent and help buyers better understand the U.S. export value chain and the Council’s role in it. Check back often to see what new visual and audio resources the Council has developed for its members, customers and others to use in sharing the story of export demand and global trade. |
About The U.S. Grains Council
The U.S. Grains Council develops export markets for U.S. barley, corn, sorghum and related products including distiller’s dried grains with solubles (DDGS) and ethanol. With full-time presence in 28 locations, the Council operates programs in more than 50 countries and the European Union. The Council believes exports are vital to global economic development and to U.S. agriculture’s profitability. Detailed information about the Council and its programs is online at www.grains.org.