Chicago Board of Trade Market News

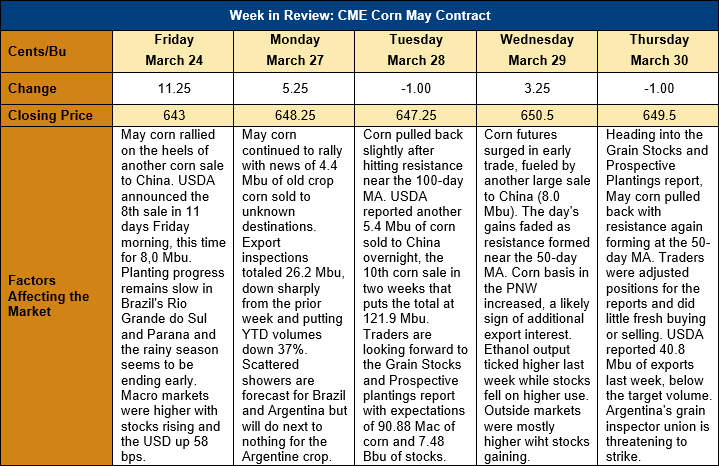
Outlook: May corn futures are 6 ½ cents (1.0 percent) higher this week as continued Chinese purchases of U.S. corn support values. This week has also featured pronounced short covering heading into the USDA’s Grain Stocks and Prospective Plantings reports on Friday, 31 March 2023. Predicting these reports has been notoriously difficult in the past, which has prompted the covering of short positions.
The major story in the corn markets this week has been China’s persistent purchases of U.S. corn. Since the last Market Perspectives report, USDA’s daily export sales announcements indicate China has booked 834.8 KMT (33.9 Mbu) of old-crop corn. That volume puts China’s total March corn purchases, as reflected in the daily export sales announcements, at 3.204 MMT (126.2 Mbu). Additionally, the weekly Export Sales report from USDA indicated China booked 709.2 KMT of net sales for old crop corn last week. China’s YTD corn export bookings are down 38 percent and total 7.514 MMT, but 40 percent of those bookings have been made in the past three weeks.
With U.S. corn exports seasonally increasing, analysts are, on average, expecting the Grain Stocks report to show 190.0 MMT (7.48 billion bushels) of corn in storage on 1 March 2023. The estimates range from a low of 183.91 MMT (7.24 billion bushels) to a high of 198.89 MMT (7.83 billion bushels). If the average pre-report estimate is correct, 1 March corn stocks would be down 3.6 percent from the same time in 2022 and represent a 30.8 percent decrease from the 1 December stocks figure.
The USDA’s Prospective Plantings report is usually one of the most widely anticipated and elicits some of the most dramatic market reactions. Based on a Reuters survey of analysts, the average estimate indicates U.S. farmers intend to plant 36.779 Mha (90.88 million acres) of corn in 2023. That figure is down slightly from USDA’s February Ag Outlook Forum prediction up 1.1 percent from 2022.
From a technical perspective, May corn is trending higher from major support at the early March lows near $6.06 ¾. The contract has taken out resistance planes at the 20-day moving average and $6.40-6.45 but now faces more significant resistance at the 50- and 100-day moving averages. Above that, resistance lies near $6.86 – the highs of the January-February congestion zone. The general market sentiment is that the February/early March selloff was overdone, especially in light of China’s renewed appetite and Argentina’s drought, and futures are now searching for a new, higher equilibrium.

