U.S. Export Statistics

Corn
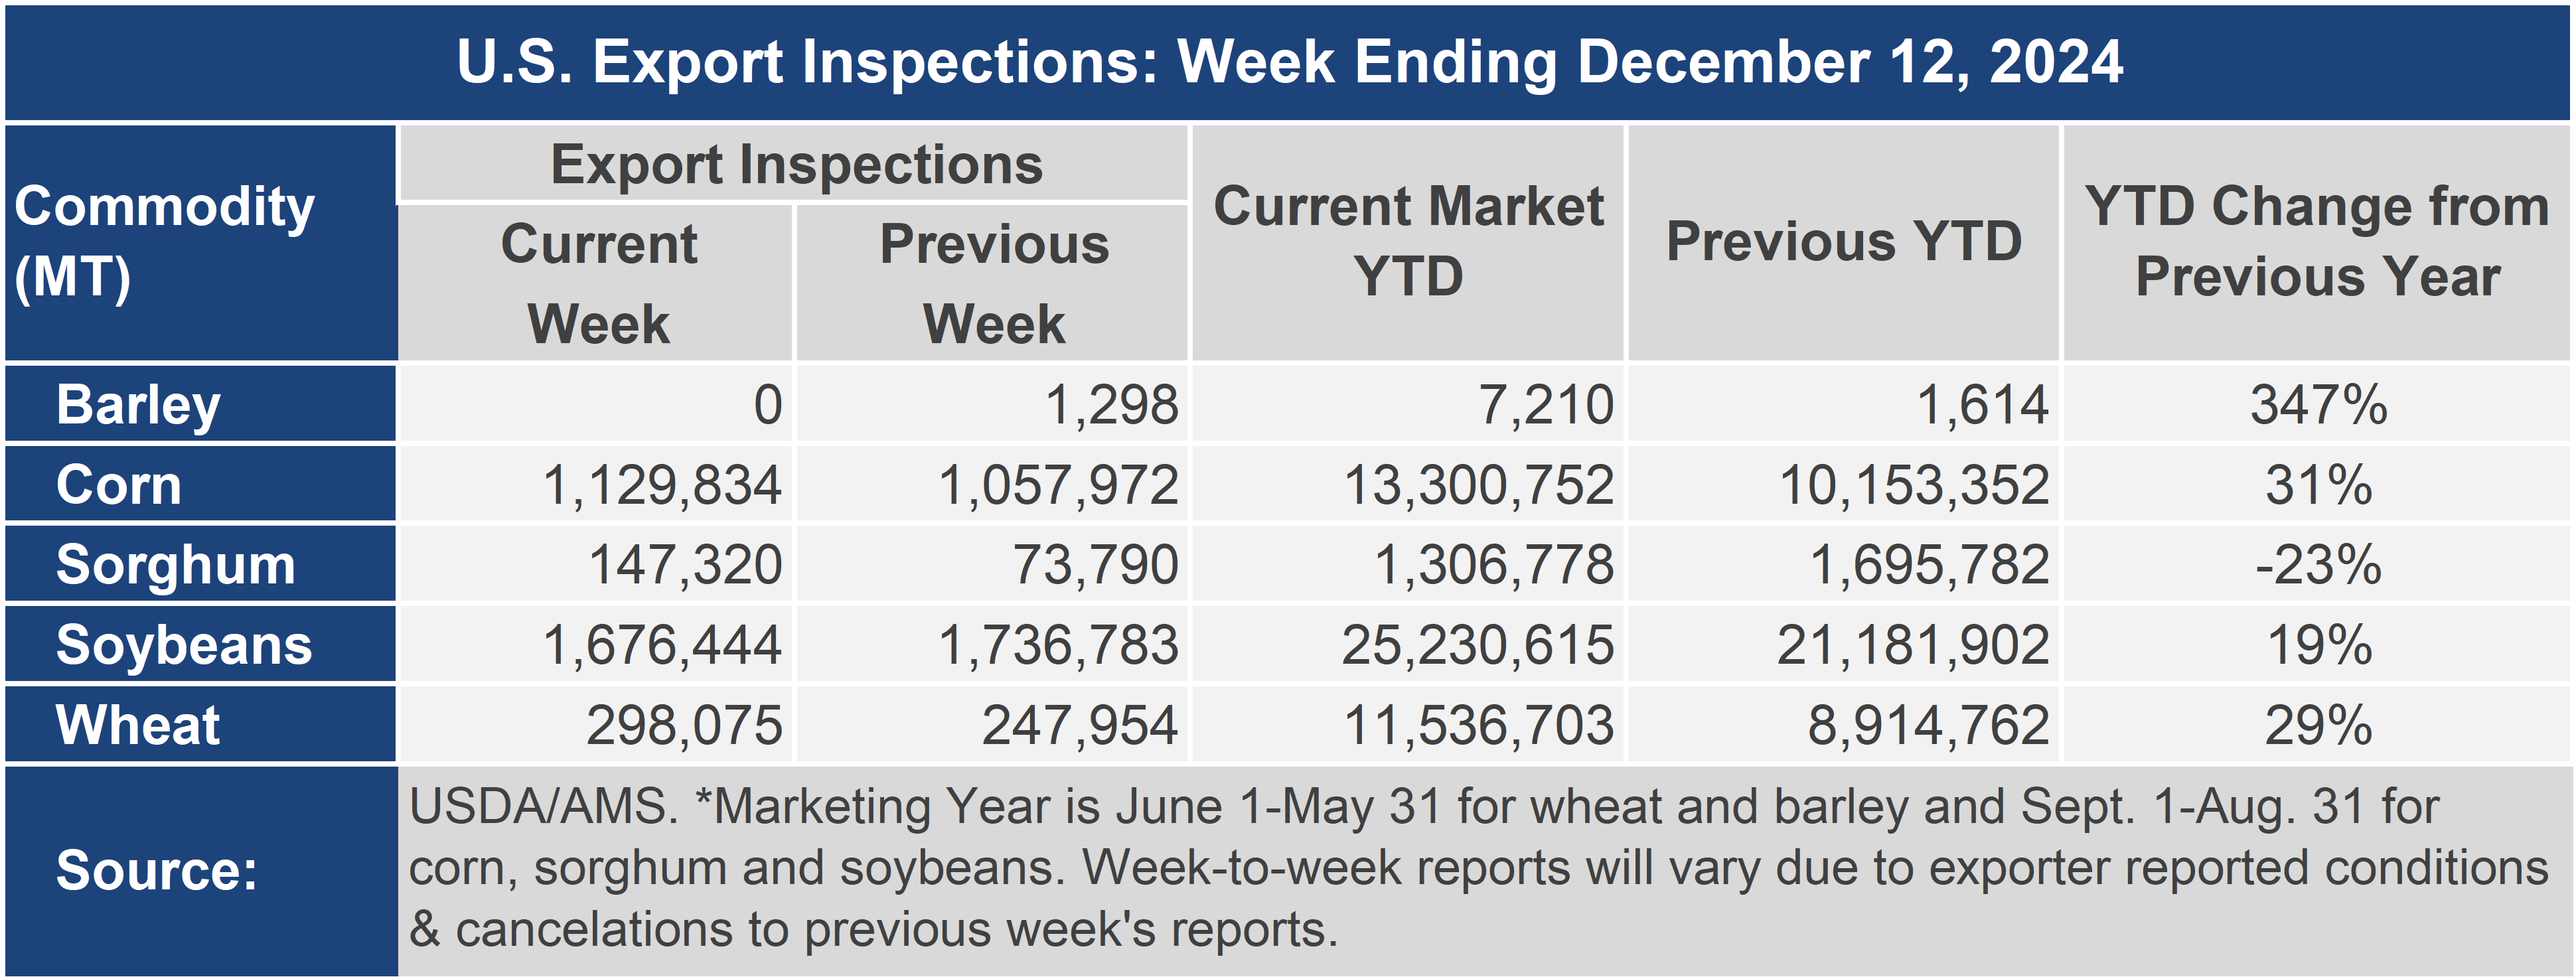
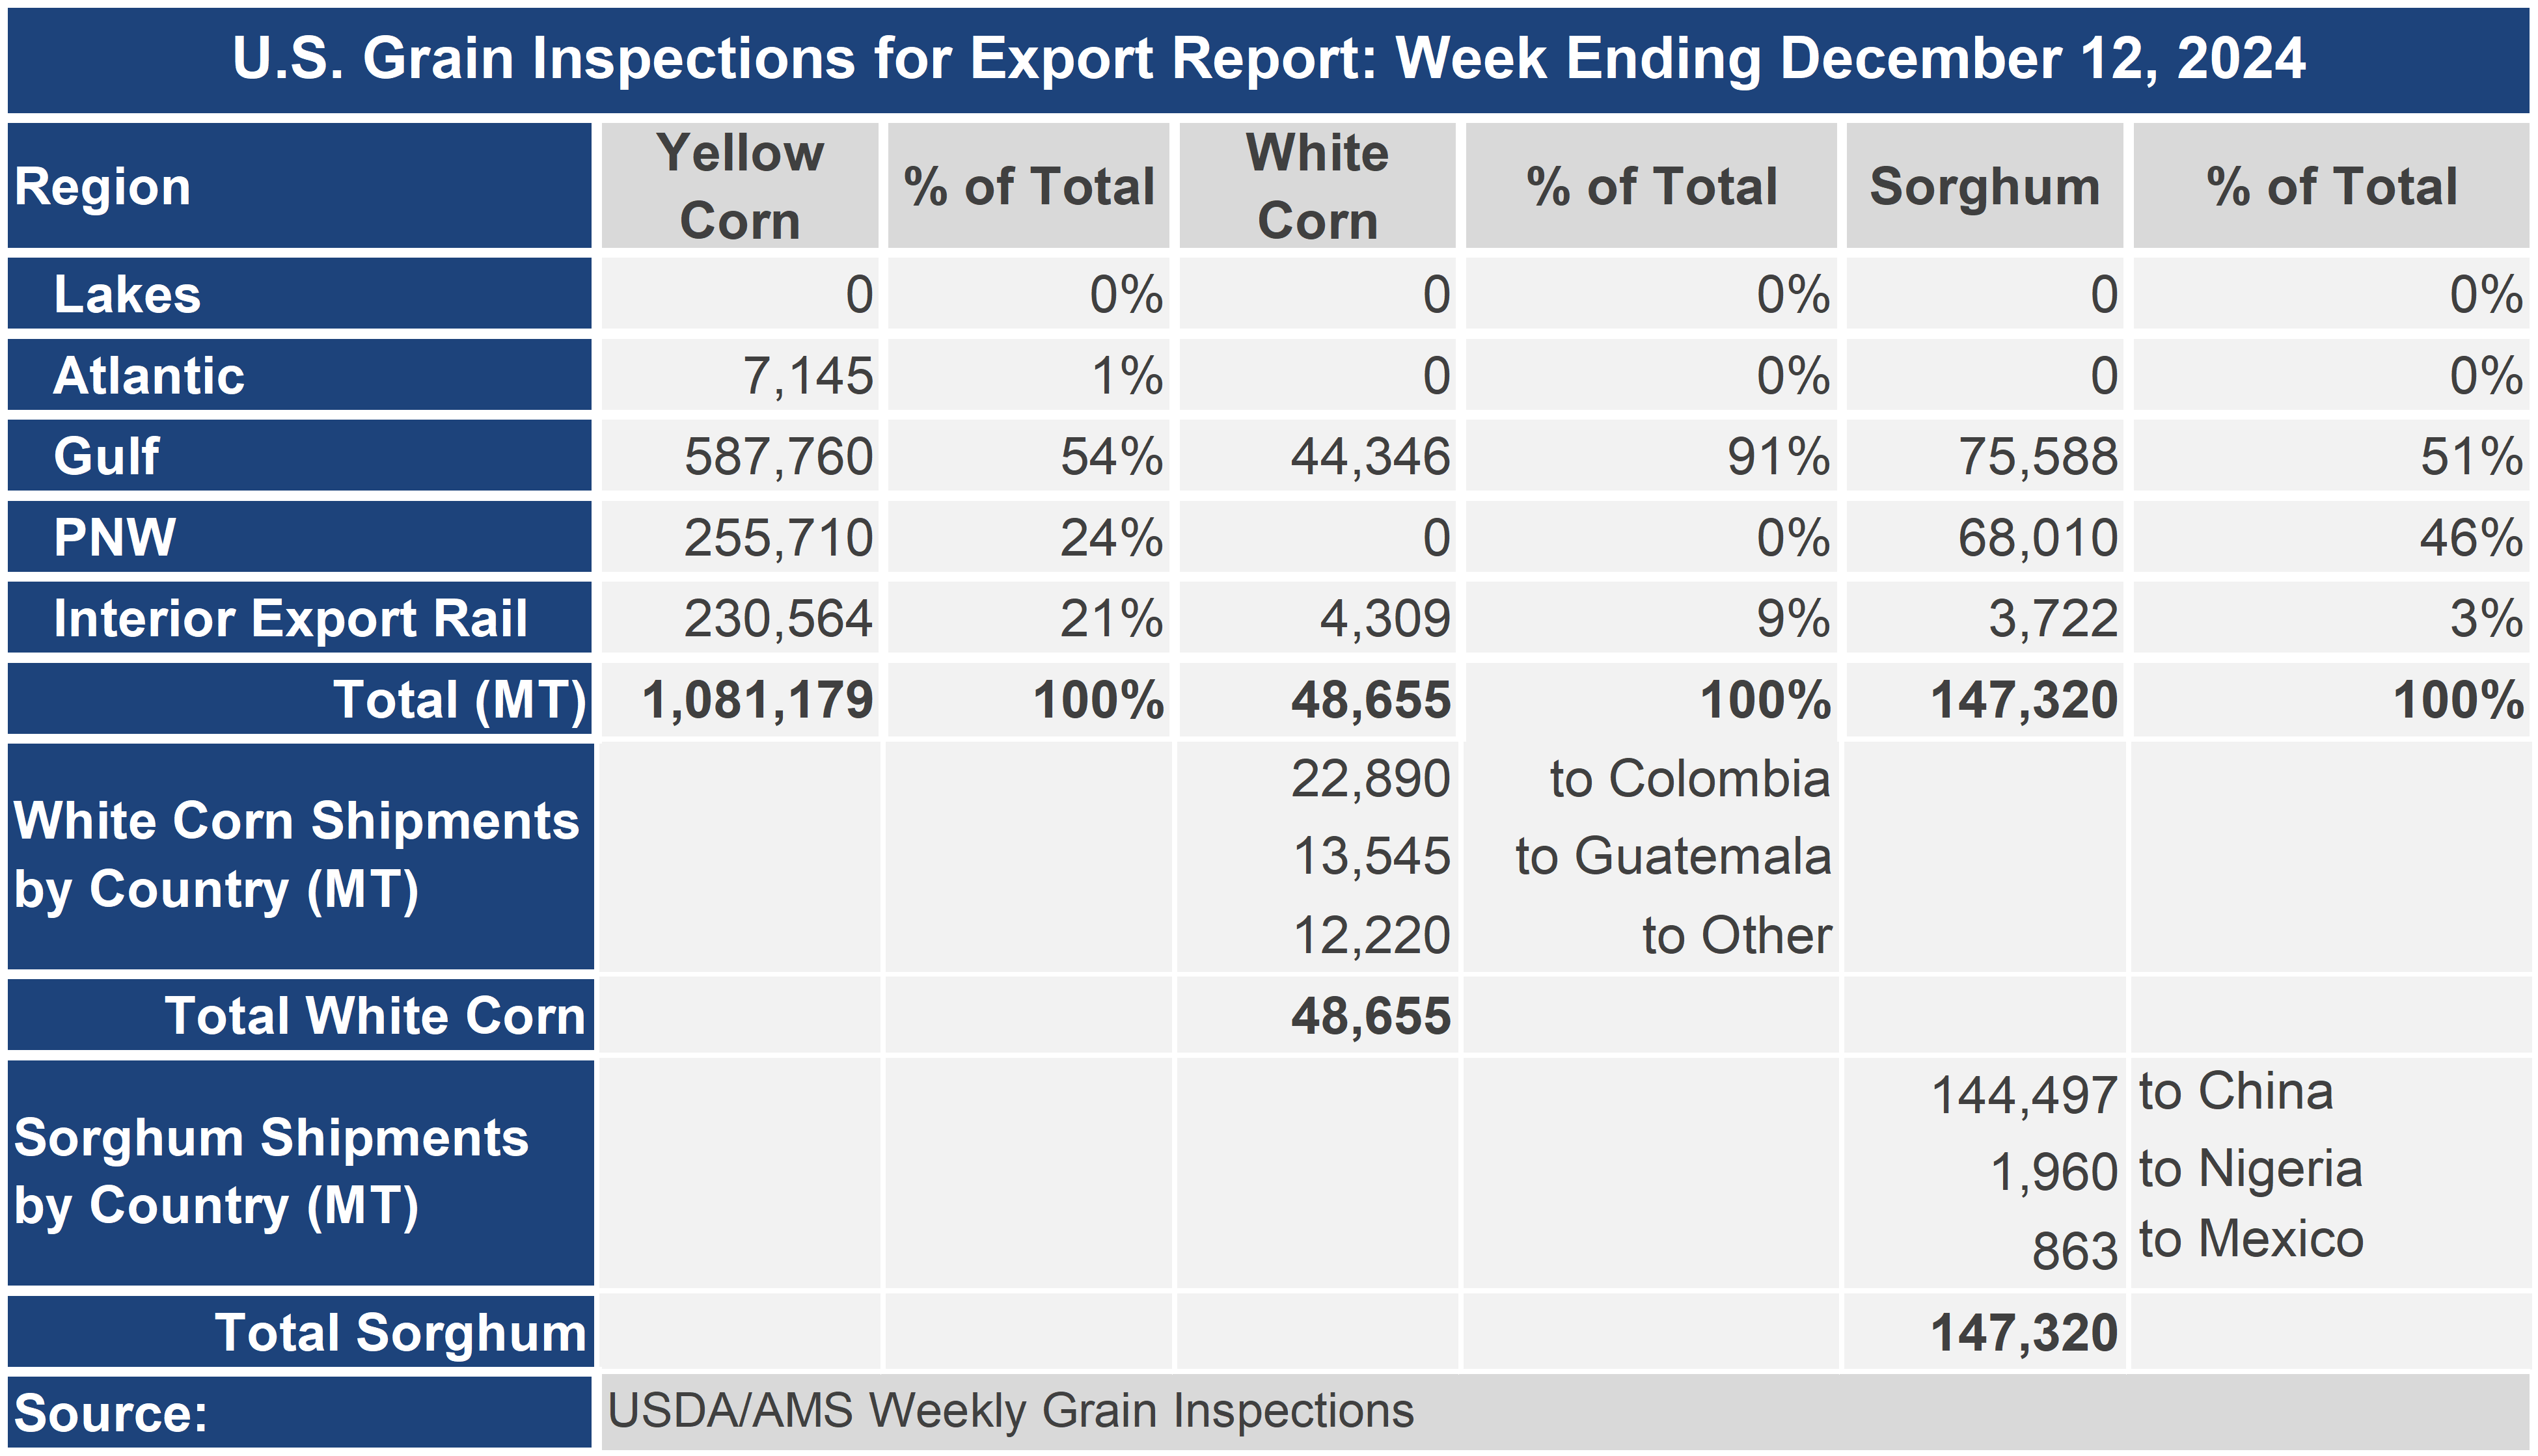
Net sales of 1,174,600 MT for 2024/2025 were up 24 percent from the previous week, but down 10 percent from the prior 4-week average. Increases primarily for Mexico (395,500 MT, including 30,000 MT switched from unknown destinations and decreases of 4,600 MT), Japan (273,100 MT, including 185,000 MT switched from unknown destinations and decreases of 2,900 MT), Colombia (204,800 MT, including 93,000 MT switched from unknown destinations and decreases of 3,600 MT), Taiwan (139,600 MT), and Spain (136,900 MT, including 131,000 MT switched from unknown destinations), were offset by reductions for unknown destinations (192,100 MT) and Honduras (25,100 MT). Total net sales of 2,500 MT for 2025/2026 were for Nicaragua. Exports of 1,054,500 MT were down 11 percent from the previous week, but up 1 percent from the prior 4-week average. The destinations were primarily to Mexico (325,800 MT), Japan (206,100 MT), Spain (136,900 MT), Colombia (97,300 MT), and Guatemala (81,200 MT).
Barley
Total net sales of 100 MT for 2024/2025 were for South Korea. Exports of 700 MT were to Canada (400 MT) and Japan (300 MT).
Sorghum
Net sales reductions of 59,200 MT for 2024/2025 – a marketing-year low – were down noticeably from the previous week and from the prior 4-week average. Increases reported for China (7,800 MT, including 67,000 MT switched from unknown destinations), were more than offset by reductions for unknown destinations (67,000 MT). Exports of 142,000 MT were up 92 percent from the previous week and 38 percent from the prior 4-week average. The destination was China.


