U.S. Export Statistics
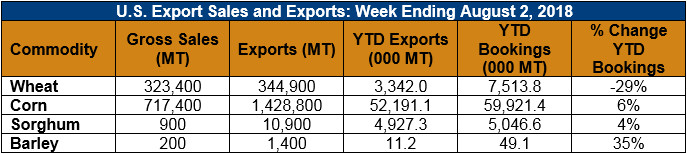
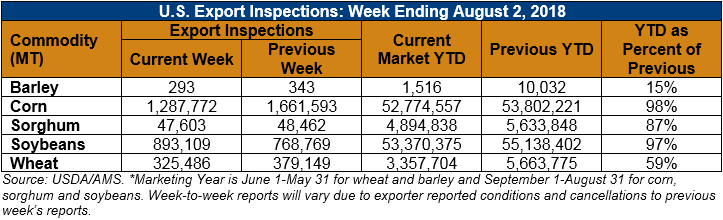
Corn: Net sales of 554,500 MT for 2017/2018 were up 90 percent from the previous week and 33 percent from the prior 4-week average. Increases were reported for Mexico (151,100 MT, including 26,000 MT switched from unknown destinations and decreases of 11,800 MT), South Korea (138,200 MT, including 133,000 MT switched from unknown destinations and decreases of 1,000 MT), Japan (93,000 MT, including 94,000 MT switched from unknown destinations and decreases of 9,600 MT), Peru (65,600 MT, including 32,000 MT switched from unknown destinations), and Colombia (60,100 MT, including 65,000 MT switched from unknown destinations and decreases of 30,000 MT). Reductions were primarily for Spain (106,200 MT) and unknown destinations (51,500 MT). For 2018/2019, net sales of 657,700 MT were reported for unknown destinations (299,100 MT), Japan (85,000 MT), Mexico (73,500 MT), and South Korea (67,000 MT). Exports of 1,428,800 MT were down 12 percent from the previous week, but up 2 percent from the prior 4-week average. The destinations were primarily to Japan (436,200 MT), Mexico (348,000 MT), South Korea (198,200 MT), Colombia (67,600 MT), and Peru (64,200 MT).
Optional Origin Sales: For 2017/2018, options were exercised to export 70,000 MT to South Korea from the United States. For 2018/2019, new optional origin sales were reported for Vietnam (130,000 MT), South Korea (69,000 MT), and unknown destinations (58,000 MT). The current outstanding balance of 720,000 MT is for South Korea (412,000 MT), Vietnam (130,000 MT), unknown destinations (108,000 MT), and Saudi Arabia (70,000 MT).
Barley: Net sales of 200 MT for 2017/2018 were reported for the Philippines. Exports of 1,400 MT were to Japan (1,300 MT) and South Korea (100 MT).
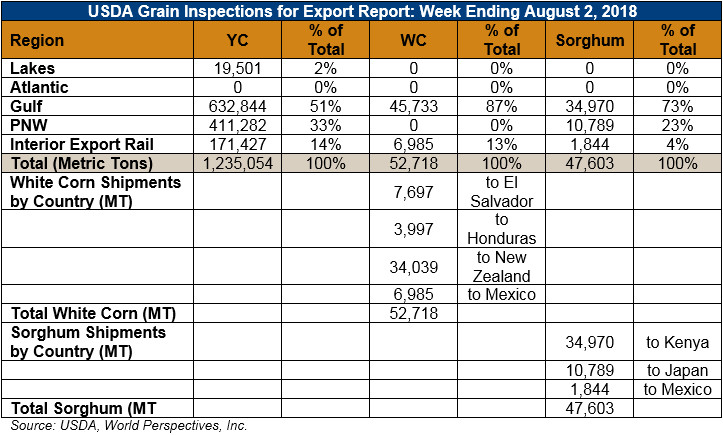
Sorghum: Net sales of 900 MT for 2017/2018 were primarily for Japan. Exports of 10,900 MT were primarily to Japan.