
II. Introduction
The U.S. Grains Council 2016/2017 Corn Harvest Quality Report has been designed to help international buyers of U.S. corn understand the initial quality of U.S. yellow commodity corn as it enters the merchandising channel. This is the sixth annual measurement survey of the quality of the U.S. corn crop at harvest. Six years of results are showing patterns in the impact of weather and growing conditions on the quality of U.S. corn as it comes out of the field.
Spring 2016 was warmer than average for almost all of the United States, with wide variation in temperatures and precipitation. These factors led to prolonged emergence that, on average, was earlier than the 5 year average (5YA) emergence.Warm, dry weather during the vegetative stage encouraged rapid growth and healthy-looking plants. In June, the warm weather and dry conditions favored brisk plant growth and nitrogen fertilizer uptake, producing a crop with a combined Good or Excellent condition rating between 70-75% that remained all season. These Good or Excellent growth conditions were similar to the 2014 crop.The summer’s above-average temperatures in the Gulf and Southern Rail Export Catchment Areas (ECAs) were mostly associated with warmer nights, potentially causing starch-accumulation stress during grain-fill and leading to the lower starch concentrations found in 2016. The wet reproductive period with warm nights created conditions conducive to possible fungal diseases. The total damage average was higher than in past years, but was still well within the limits for U.S. No. 1 grade.
Although this year’s crop matured faster than previous years, abundant rains hindered a timely harvest in several regions, resulting in a few areas of high-moisture corn. However, despite the delayed harvest in these regions, drier areas advanced more quickly to harvest.
Overall, the 2016 season experienced an about-average harvest duration, and early-harvested grain will be dried to prevent possible disease spread. Average moisture content was relatively low, and whole kernel percentages were higher than preceding years, which, with the observed low stress cracks, should lead to low breakage susceptibility in handling and good storability. Overall, the weather in 2016 led to high yields, with high test weight, large kernels, low stress cracks, and high oil concentration averages.
These observations show quality differences among the six years, but overall, the 2016/2017 Harvest Report indicates good quality corn entering the 2016/2017 market channel. 65.5% of the samples meet all requirements for No. 1 grade, and 87.8% meet No. 2 grade or better. Average moisture content and total damage values show a crop that will store and handle well as it moves through the market channel to export.
Six years of data have laid the foundation for evaluating trends and the factors that impact corn quality. In addition, the cumulative Harvest Report measurement surveys enable export buyers to make year-to-year comparisons and assess patterns of corn quality based on crop growing conditions across the years.
This 2016/2017 Harvest Report is based on 624 yellow commodity corn samples taken from defined areas within 12 of the top corn-producing and exporting states. Inbound samples were collected from local grain elevators to observe quality at the point of origin and to provide representative information about the variability of the quality characteristics across the diverse geographic regions.
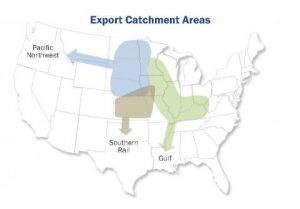
The sampling areas in the 12 states are divided into three general groupings that are labeled Export Catchment Areas (ECAs). These three ECAs are identified by the three major pathways to export markets:
- The Gulf ECA consists of areas that typically export corn through U.S. Gulf ports;
- The Pacific Northwest (PNW) ECA includes areas exporting corn through Pacific Northwest and California ports; and
- The Southern Rail ECA comprises areas generally exporting corn to Mexico by rail from inland subterminals.
Sample test results are reported at the U.S. Aggregate level and for each of the three ECAs, providing a general perspective on the geographic variability of U.S. corn quality.
The quality characteristics of the corn identified at harvest establish the foundation for the quality of the grain ultimately arriving at the export customers’ doors. However, as corn passes through the U.S. marketing system, it is mingled with corn from other locations; aggregated into trucks, barges, and rail cars; and stored, loaded, and unloaded several times. Therefore, the quality and condition of the corn changes between the initial market entry and the export elevator. For this reason, the 2016/2017 Harvest Report should be considered carefully in tandem with the U.S. Grains Council 2016/2017 Corn Export Cargo Quality Report that will follow early in 2017. As always, the quality of an export cargo of corn is established by the contract between buyer and seller, and buyers are free to negotiate any quality factor that is important to them.
This report provides detailed information on each of the quality factors tested, including averages and standard deviations for the aggregate of all samples, and for each of the three ECAs. The “Quality Test Results” section summarizes the following quality factors:
- Grade Factors: test weight, broken corn and foreign material (BCFM), total damage, and heat damage
- Moisture
- Chemical Composition: protein, starch, and oil concentrations
- Physical Factors: stress cracks/stress crack index, 100-kernel weight, kernel volume, kernel true density, whole kernels, and horneous (hard) endosperm
- Mycotoxins: aflatoxin and DON
In addition, this Harvest Report includes brief descriptions of the U.S. crop and weather conditions; U.S. corn production, usage, and outlook; and detailed descriptions of survey, statistical analysis, and testing analysis methods.
New to this 2016/2017 Harvest Report is a simple average of the quality factors’ averages and standard deviations of the previous five Harvest Reports (2011/2012, 2012/2013, 2013/2014, 2014/2015, and 2015/2016). These simple averages are calculated for the U.S. Aggregate and each of the three ECAs, and are referred to as “5YA” in the report.