Supply/Demand Basics
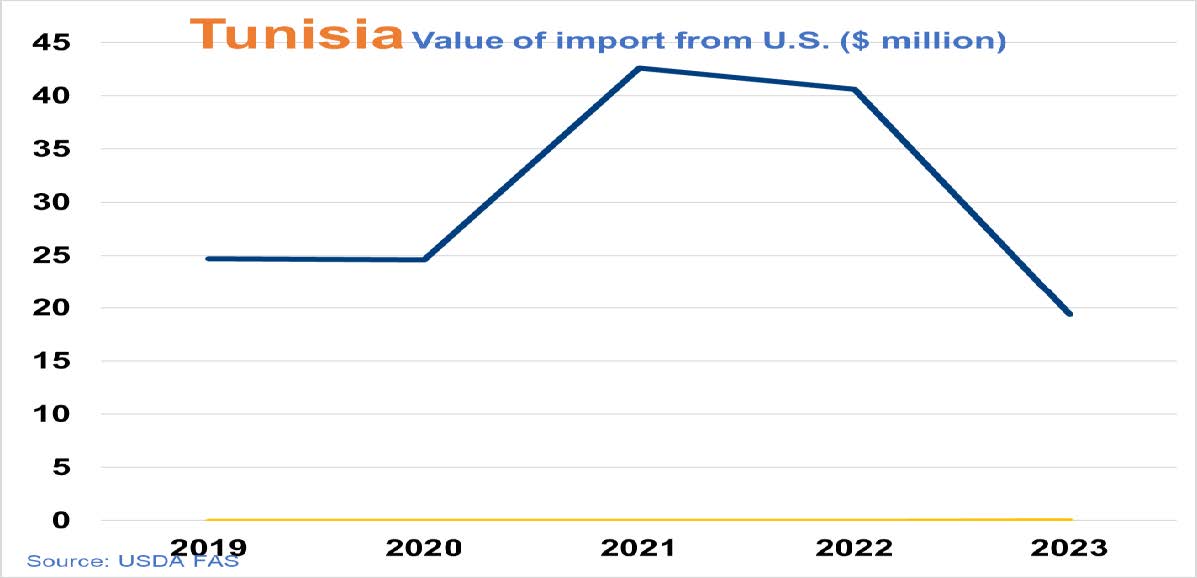
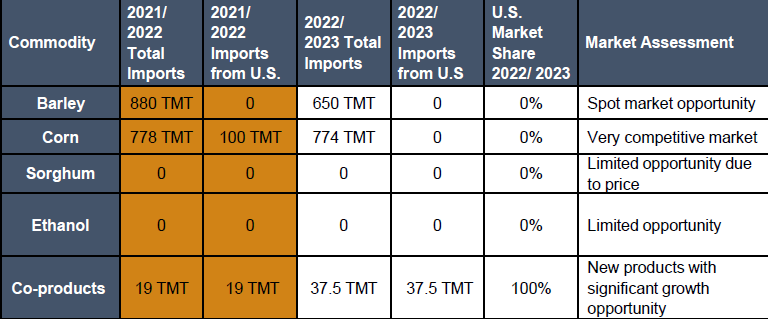
-Corn imports remain on the same level compared to the previous MY but less than 20% when compared to prior Covid-19 driven by the high prices and less demand from households.
-30 TMT of regular U.S. DDGS was imported by the industry compared to 16 TMT shipped the previous MY.
-U.S. corn gluten meal shipped doubled up (6 TMT compared to 3 TMT the previous MY) led by demand from the aquaculture industry.
Country Overview

-Tunisia’s economic performance slowed after the 2011 revolution, resulting in a decade of lost growth, exacerbated by the COVID-19 pandemic in 2020.
-Agriculture (down 9 percent year-on-year mainly due to low rainfall) was the main driver of the 2023 economic slowdown.
-The Tunisian dinar has remained stable against the U.S. dollar for the fourth consecutive year.
Trade and Market Share Overview
-The Council’s regional office for the Middle East, Africa and Europe is located in Tunisia.
-Ukraine, Romania and Russia are the main suppliers of barley to Tunisia.
-In MY 2022/2023, corn shipment to Tunisia mainly originated from the black sea (85%) while the remainder was imported from South America.
-1000 MT of U.S corn fermented Protein is imported driven by high demand from the Tunisian aquaculture feed manufacturer.
Policy Overview
-There is no import duty on feed grains, except for a 2.5% duty on corn, sorghum and SBM.
-In 2022, U.S. agricultural exports to Tunisia totaled $212 million, with soybeans and corn and co-products accounting for over 70%.
-Due to historical and geographic reasons, the European Union heavily influences Tunisia’s agriculture policy.