Supply/Demand Basics
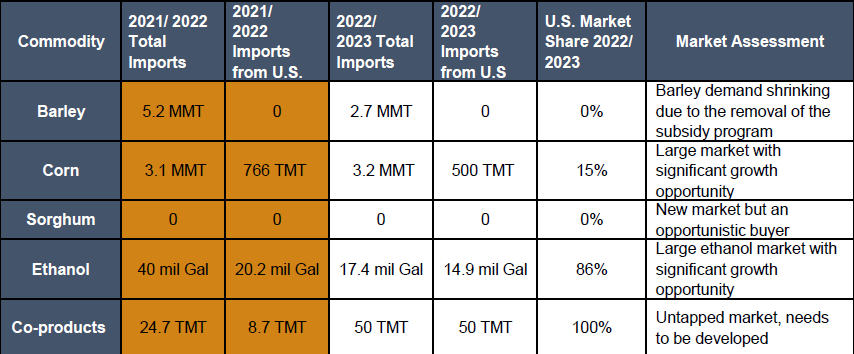
-Corn imports were 3.2 MMT, while the U.S. market share dropped by 34%, primarily due tocompetitiveness vs. South America. U.S. corn is still regarded as the highest quality for dairy feed.
-Saudi Arabia imported 2.7 MMT of barley representing a 45% decrease when compared to the previousyear, in line with the schema of lifting subsidies in 2020.
-DDGS imports rose to 50 TMT from the U.S. compared to 8.7 TMT imported the previous MarketingYear. In MY 2022/2023, all the DDGS was shipped from the United States.
Country Overview

-Saudi Arabia’s economy is the largest in the Middle East and the eighteenth-largest in the world.
-The petroleum sector accounts for roughly 87% of Saudi budget revenues, 90% of exportearnings, and 42% of GDP. Saudi Arabia’s oil reserves and production are largely managedby the state-owned corporation Saudi Aramco.
-As strategic framework referred to Vision 2030, the economy in the Kingdom of Saudi Arabia is shifting away from being solely based on oil and looking to attract tourists, adventurers and foreign investment.
Trade and Market Share Overview
-Brazil led the corn import in Saudi Arabia with 1.4 MMT followed by Argentina with 1.1 MMT. The United States came third with a 15% market share.
-Saudia Arabia’s barley imports decreased due to significant reductions in the local livestockfarming sector. The main suppliers of barley are Australia, Russia, and the EU.
-Aquaculture has been a rapidly growing industry. Saudi Arabia’s efforts to increase its aquacultureproduction volume to 600 TMT by 2030 received a major boost after two state-controlled institutions signed an agreement with American global food corporation Cargill toexpand fish farming in the country.
Policy Overview
-The government is incentivizing an increase in both aquafeeds and broiler feed production, in conjunction with its Vision 2030 initiative that will prepare the country to accept tourists from around the world.