Supply/Demand Basics
-Corn use: feed 75%; starch 24%; other food use 1%.
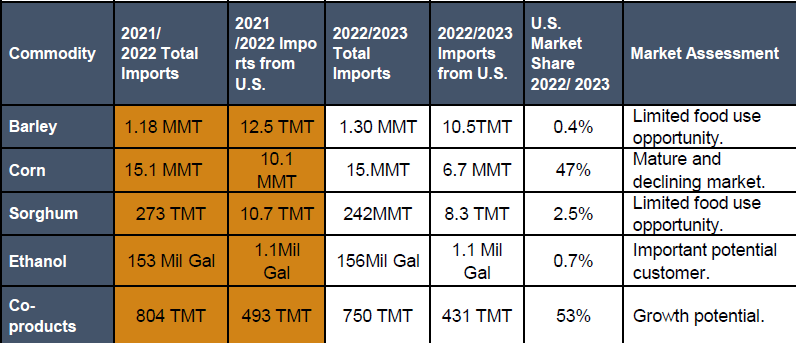
-#3 import market for U.S. corn and U.S. barley in MY 2022/2023.
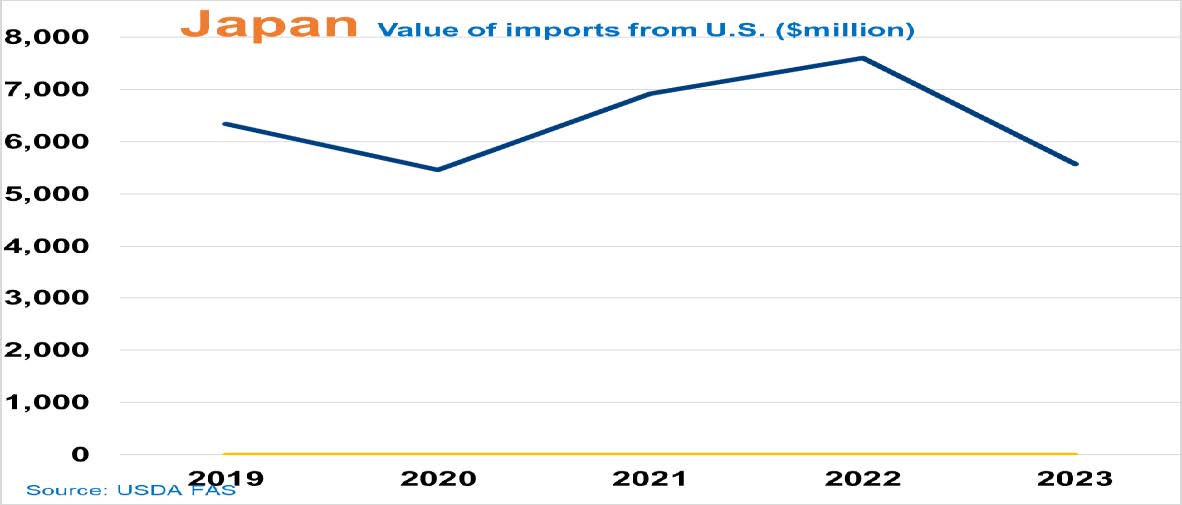
-Feed grain imports remain stable at 16 to 17 MMT/year
-Japan imported 423 TMT of U.S. DDGS in MY 2022/2023.
-Dry milling sector’s U.S. corn market share stays at100% in MY 2022/2023.
Country Overview
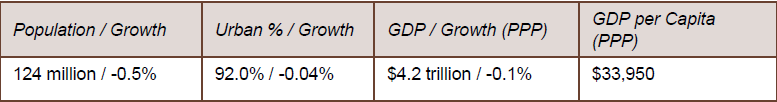
-Stagnant economy further impactedby Ukraine-Russia conflict and COVID-19.
-Highly subsidized, small agricultural sector; dependent on imported raw materials and fuels.
Trade and Market Share Overview
-The aging population and changing consumer preferences mean little growth in total food demand.
-High health consciousness with relatively high income has led to demand for health-oriented, value-added foods.
-Still committed to buying from the U.S. (volume, reliability, origination investments), however, Japanese industry beginning to diversify sources of feed ingredient imports.
-217 million gallons of ethanol blended as ETBE, at a 1.9% blend rate. The United States is estimated to have taken 70% of the market in 2023 with full market access due to lowering the LCA value of U.S. corn bioethanol in 2023.
Policy Overview
-Phase 2 U.S.-Japan bilateral trade agreement and IPEF negotiation should go towards more favorable treatment of agricultural products.
-Biotech regulatory systems both on genetic engineering and PBI are reasonably science-based but may need further simplification.
-Japan’s biofuel policy has allowed full market access to U.S. bioethanol due to GHG emission reduction requirements.
-Japan declared 340 million gallons of SAF use in 2030